Tag: metabolic phenotyping

  • Black boxes versus traceability in metabolic measurement

    Anyone who has read Chapter 13 of my book knows that I have a hobby-horse: the accuracy of metabolic rate measurement, especially in the metabolic phenotyping systems that are so widely used in the biomedical field. Now I’ve taken steps to make some of my (and others’!) misgivings known. 

    It’s really frustrating to watch otherwise capable researchers in the biomedical field flock to use the same black-box metabolic screening systems that others used before because, well, everyone uses them.

    Of course there are good reasons for this situation. There’s a natural wish to use systems that have become accepted in the field, even if the underlying reasons may not hold up to close examination.

    Yet a metabolic phenotyping system built for traceability and transparency can be used just as effectively by someone who doesn’t know or care how it works. The difference between that and a black-box system (which shares the lack of any requirement for understanding) is that if someone wishes to understand the behind-the-scenes operation of the system built for traceability and transparency, including all its corrections, assumptions and calculations, then that understanding is possible.

    But it isn’t easy to convince scientists to move to transparent, traceable systems. Which is too bad, because important decisions can be made on the basis of data produced in questionable yet untraceable and unauditable ways. Rather, scientists are attracted to the familiar. Here’s my humorous take on this herd reaction:

  • Welcome to the revitalized Respirometry.org!

    Just a quick post to let the teeming multitudes (all three of you) know that Respirometry.org’s long stasis is at an end. I’ll be posting new content on a regular basis, much of it available nowhere else. I’ll be blogging muchly about Promethion, a new metabolic measurement system for biomedical researchers, but also on other topics.

  • The future of metabolic phenotyping

    Data from a parallel, continuous metabolic phenotyping system (black line) vs. a multiplexed system (red line)

    The essence of metabolic phenotyping is accurate metabolic measurement. As a matter of convenience, cost and feasibility, practically all metabolic phenotyping systems operate in a multiplexed mode, in which a single gas analysis chain is shared between multiple animals, typically 8, 10, 16 or more. Cycle times between metabolic measurements for a given animal vary widely between systems, ranging (in the case of 16 animals) from 2 minutes for an optimized Promethion-M Multiplexed metabolic phenotyping system to as much as ~45 minutes for its competitors. The result is a heavily sub-sampled data set from which much fine temporal detail is missing or distorted.

    The picture above is worth a thousand words. It shows the output of a brand new Promethion-C Continuous, parallel metabolic phenotyping system. Data from one of sixteen animals (mice, strain C57BL/6J) is shown. Eight at a time were measured simultaneously, without multiplexing, and the system is capable of indefinite expansion (one pharmaceutical company has a 24-channel Promethion-C system). Click on the picture to embiggen it. Data on VCO2, food and water uptake, body mass, water loss rate etc. were also acquired synchronously but are not shown. For more on this topic, including an excellent interactive visualizationof the distortions caused by multiplexing, visit this later blog post.

    The multiplexed system (red lines) was simulated from the output of the Promethion-C system*, assuming a 30 minute cycle time, which is faster than average. As you can see, the Promethion-C system (black trace) tracks each metabolic excursion by the animal, as it alternates between rest, pedestrian locomotion, and wheel running, with extraordinary fidelity. The data storage interval of the Promethion-C metabolic phenotyping system is one second for all attached sensors.

    Now that Promethion-C is available, it is extremely hard to justify acquiring multiplexed metabolic phenotyping systems any longer unless cost is an overriding factor. If that is the case, Promethion-M offers the fastest cycle times available – for example, down to 2 minutes cycle time for a 16-cage system. Like all Promethion systems, Promethion-M also offers the many traceability and transparency benefits of complete raw data retention. Plus, most components of a Promethion-M system can be used in your Promethion-C system if you ever decide to upgrade.

    Designing and building a “massively parallel”, continuous, multi-animal metabolic phenotyping system is far from easy. This is especially true if the system stores all of the raw data from all sensors – a requirement for good laboratory practice. The bandwidth requirements are formidable, as are the requirements for implementing suitably flexible data analysis protocols. There is no way this massive exercise in coordinated integration will work unless, as with Promethion, the manufacturer has total control over all aspects of the design of all instrumentation comprising the system. This we do. As a result, Promethion-C is up and running, in production, a documented and field-proven product with multiple installations in the field.

    As the chief designer of both Promethion systems, it’s been a privilege to have the opportunity to turn my knowledge of respirometry and passion for innovation to practical use for the biomedical community!

    If you have any questions, contact me.

     — John Lighton

    * Thanks to Thomas Förster, Ph.D., Sable Systems International’s expert in-house data analysis and data presentation consultant, for running the simulation and creating the graph.


  • Data, data, data!

    This shows a day’s worth of data from a single mouse in graphic form, recorded by a Promethion-C system for a research study on which I’m collaborating. The time resolution of the data set is one second. Loads of additional data (such as XY position and so on) didn’t make it into the graph but are waiting in the wings in case they’re called on for duty. Click on the graph* to embiggen it.

    So, what’s happening? The top panel shows VO2 and VCO2 (rate of O2 consumption and CO2 production, respectively). You can see they’re quite variable, and that most of the variability is explained by the next panel, which displays wheel running and non-wheel pedestrian locomotion in blue and orange, respectively. You can see how the VO2 and VCO2 traces faithfully reflect the increased metabolic rate that accompanies locomotion. The next panel, RQ, shows the fuel that the animal is burning. It can vary from 0.7 (fueled entirely by fat) to 1.0 (fueled entirely by carbohydrates). As you can see, when the mouse is running, it shifts the fuel it is burning more towards carbohydrates. Next we have food and water uptake, then below that, the body mass of the mouse. (You might wonder how that’s measured; inside the cage there’s a cute little habitat attached to a high-resolution mass sensor, and the mouse gets weighed each time it enters and leaves the habitat. The food and water uptake sensors work in a similar, differential way). You can see how the mouse’s body weight (or body mass, to be rigorous) increases when it goes through feeding and drinking bouts. And finally, we have something that only Promethion can measure in the metabolic phenotyping arena, which is water loss rate. That’s the sum of the water the mouse ate and drank and later excreted, and the water the mouse produced metabolically. You can see how closely it tracks metabolic activity. Metabolic water production can be very significant. Would you believe that 1 gram of fat produces over a gram of metabolic water?

    Just a tiny appetizer, a soupçon, of what you can get from a good metabolic phenotyping system.

    — John Lighton

    * Thanks to Thomas Förster, Ph.D., Sable Systems International’s expert in-house data analysis and data presentation consultant, for creating the graph.

  • Measuring food uptake differentially

    Let’s say you need to measure the food uptake of an experimental animal, which of course could mean any creature, including you. For the sake of simplicity, imagine a mouse or a rat feeding intermittently from a food hopper.

    You’d think that all you needed to do was weigh the hopper periodically, such as at the start and end of each 24-hour cycle, and see how much its mass decreases. You’d be right, in a sense. That will indeed measure the change in food mass over that period. But if you think that the change in mass is an accurate representation of the amount of food the critter ate, you might be very wrong.

    This is because most food, including rat or mouse chow, is hygroscopic. It absorbs water from the water vapor in the air to an extent roughly proportional to relative humidity. And relative humidity is anything but constant, particularly inside a cage. As a result, neither is food mass.

    To get accurate food uptake figures, you need to measure differentially. In other words, food uptake must be calculated from the difference in food hopper masses just before and just after each feeding event. This figure* (where d is food hopper mass) illustrates the point.

    As you can see, a feeding event corresponds to a large increase in the variance of the measured food hopper mass. A good food uptake calculation algorithm, such as the one used by Promethion, searches for sections of stable mass readings immediately before and after each such event. Then it compares those readings and tests them for statistical significance. If a significant difference is found, the event is designated as a food uptake event. If not – and a surprising number of interactions with the food hopper don’t result in significant food uptake – then it’s ignored.

    As a result, slow changes in hopper mass resulting from fluctuations in relative humidity no longer distort food uptake data.

    True, but analyzing the problem at a deeper level, the mass of food that is eaten, however accurately it’s measured, still reflects the sum of two partitions:

    1. The dry weight of the food that is eaten
    2. The weight of water associated with the food

    The water content of typical mouse or rat chow is about 10-15%, so the error can be significant. Dry food mass would be a much better measure of food uptake.

    Funny you should say that. Because the Promethion system (unlike any other food uptake measurement or metabolic phenotyping system) measures water vapor partial pressure in the air pulled from the cage, it is possible, knowing this, to back-calculate food mass to its “dry” state, mathematically. All that is required is a good characterization of the chow’s mass versus ambient water vapor partial pressure.

    Not a single researcher anywhere in the world is yet doing this. But it’s possible (though only with Promethion). I wonder who will be the first to fill this vacuum?

    — John Lighton

     * Thanks to Thomas Förster, Ph.D., Sable Systems International’s expert in-house data analysis and data presentation consultant, for creating the graph.

  • Three reasons for misleading gas analyzer accuracy specifications

    A funny thing happened on my way to helping a colleague make sense of the specifications of a metabolic phenotyping system. There were many strange things to mull over. Not the least of these were oxygen and carbon dioxide analyzer accuracy specifications that appeared to be the product of smoke, mirrors, and absinthe-infused coca tea sipped through a crazy straw.

    Then it struck me: A sense of déjà vu all over again. I’ve seen similarly bloated and unwordly specifications made by the manufacturers of human metabolic measurement equipment. Why is it that companies that serve the biomedical market feel compelled to exaggerate analyzer specifications beyond the bounds of credibility? Curious minds want to know.

    For that reason, I’m transcribing my spiral-bound anthropological notebook and presenting here my own, brief, analysis of the phenomenon.

    Reason one is specialization. Scientists and researchers in general know a great deal about their subject (well, most do) but outside their area of expertise, not so much. Thus, they are vulnerable to exaggeration and outright untruth in areas outside their field of expertise. This is especially with regard to matters such as accuracy versus precision, and measurement theory in general.

    Reason two is inconsistent terminology. Accuracy is an elastic concept, and unless you’ve had some exposure to measurement theory you will consider accuracy, quite reasonably, to be a measure of relative error. We can all agree that 0.000% accuracy implies that a measurement is made without error. But what does “0.04% accuracy” mean? This is the accuracy that one metabolic phenotyping system manufacturer claimed for their third-party O2 and CO2 analyzers.

    UPDATE added in 2017:  Some legacy metabolic phenotyping system manufacturers have now jumped the shark!  Not content with claiming 0.04% accuracy, they are now claiming “0.001% of reading accuracy”. Their previous fictitious specifications were already unreachable, and now, they have managed to make them 40 times more unreasonable and dishonest. But back to the main text: 

    Here is where things get interesting. In order to evaluate the accuracy of an analyzer, you must use it to measure an accurately known standard, and then determine the error in its measurement of that standard. Say, for example, you pass an exactly known 1.0000% CO2 standard gas through the analyzer, and the analyzer reads 1.0004%. In that case, the error (in percent of reading) is 100 * (1.0004 – 1.0000), or 0.04%. Notice the number of significant figures? in order to measure this degree of accuracy, our CO2 standard gas must be exactly 1.0000%, not 1.0001% or 0.9999%.

    Here is where the real world pokes its muzzle into this ideal world and barks, loudly.

    Because the fact is, it is literally impossible to obtain such accurate gas mixtures. Not difficult. Impossible. This is for a variety of technical reasons I’ll explain if there’s some demand for it. But bottom line, the most perfect span gas anyone can buy is 1% accuracy. This means that the actual concentration of the CO2 span gas mentioned above will be anywhere from 0.99% to 1.01%. So as you can see, in most cases – and always, with CO2 analyzers – any accuracy figure of better than 1% is garbage, pure and simple. The sole exception to this is if you manage to persuade a national standards laboratory to create some 0.25% or so accuracy span gas, for which you will pay many thousands of dollars. In that case, you are equipped to evaluate accuracy down to 0.25%, if you make the assumption that the only cause of error is from the standard gas concentration. Which is highly questionable, as any student of measurement theory will tell you. Plus, you can only measure the error and thus the accuracy of the analyzer at that one concentration, because there is no way of mixing that gas to create a lower concentration without introducing a new source of error in the 1-2% range.

    But 0.04% accuracy? Srsly?

    There is one accuracy specification that allows this amazing specification. As Dr. McCoy would say, it’s accuracy, Jim, but not as we know it. And that is to express accuracy in absolute terms at some point in the analyzer’s measurement range. In the case of the system specifications I was looking at, the maximum CO2 concentration it could measure was 2%. Let’s say the analyzer was fed a nominal 2.00% span gas, and actually measured 2.04%. In that case, its absolute error could be stated as 0.04%, and I suspect that this is exactly what the drafter of that metabolic phenotyping system’s specifications had in mind.

    Was the metabolic phenotyping system manufacturer trying to mislead its potential customers? I leave that for the reader to decide.

    Bearing on that last question, here is an interesting fact. The metabolic phenotyping system in question uses a combination O2 and CO2 gas analyzer made by Siemens, a very solid and reputable industrial process-control firm. Siemens is not given to flights of fancy. So, what does Siemens give as the accuracy specification of that analyzer, as shown in the analyzer’s downloadable instruction manual?

    In fact, Siemens says exactly what they should say: “Calibration error: Dependent on accuracy of calibration gases”. This is the only accuracy specification they give. They do, however give two other specifications that are important when considering accuracy: Repeatability and linearity deviation, both of which are 1%, again showing that the claim of “0.04% accuracy” for that same analyzer is, shall we say, imaginative.

    Reason three is peer pressure. For some reason, there is a red queen race going on among biomedical equipment suppliers. Some of them are tripping over themselves to invent fantastical accuracy specifications that will impress researchers who are not used to thinking critically about accuracy specifications – not because the researchers are stupid, or credulous, but because they make the assumption that equipment manufacturers and resellers are being as honest as they (the researchers) are.

    And that isn’t always the case. Worse than that, paying uncritical attention to accuracy figures may lure researchers into a lair which, in hindsight, they will wish they had not entered. And that’s a pity for their research, for their funding agencies, and for human curiosity.


  • How Multiplexing Distorts Metabolic Phenotyping Data

    Multiplexing metabolic signals causes significant data distortion. This post explains how, and gives you access to an amazing, interactive tool for exploring the metabolic data distortions produced by this practically universally-used technique!

    To save cost, almost all metabolic phenotyping systems multiplex their gas analyzers, so that the air streams from the metabolic chambers are analyzed in succession. As a result, it takes an appreciable time for the gas analyzers to sample repeatedly from a given cage. The time between successive samples from a given cage is referred to as the cycle time. For 16 animals, the cycle time can vary from 5 minutes (Promethion-M system at its fastest recommended setting) to over 40 minutes (systems from other manufacturers).

    Multiplexing distorts metabolic data in three primary ways.

    1. The cycle time imposes a limit to the fastest events that can be recorded. If a metabolic event occurs between two cycles, it will not be detected at all. As a result, multiplexed data always overestimates resting energy expenditure (REE) and underestimates active EE (AEE).
    2. If an animal changes its EE in a cyclical fashion, multiplexing can severely distort metabolic data through a phenomenon known as aliasing. This can cause enormous under- or over-estimates, particularly of AEE but potentially of REE as well.
    3. The point in time at which the recording starts will significantly affect the measured metabolic data. This effect is purely stochastic and out of the control of the researcher, because it relates to phenomena in the future.

    The only way to avoid these problems entirely is to record metabolic data continuously. The only commercially available system capable of this feat for multiple animals is the Promethion-C system Continuous metabolic phenotyping system (brochure here). It has one-second time resolution for metabolic data (and all other types of data) from an essentially unlimited number of animals. It is an up-and-running, fully documented system in active production – not an experimental prototype will-o’-the-wisp that dooms researchers to month after month of painful, time-sucking frustration and wasted effort (believe me, we’ve heard the stories). Without Promethion’s advanced proprietary technologies I seriously do not think that the parallel, continuous approach is feasible. You can read a bit more about multiplexed vs. continuous metabolic measurement systems in this poster (AALAS, 2012).

    We have created an interactive tool to allow you to explore the metabolic data distortions caused by multiplexing. Before clicking on the link, please read a bit about how the tool works.

    • The page will take a little while to load, because it is accompanied by a substantial data file.
    • The interactive graph is optimized for a monitor resolution of 1700 pixels. If you have a smaller monitor you will need to scroll about a bit to see (for example) the Y axis on the right side of the graph.
    • To set the start point for the multiplexing, click on the graph. The simulated multiplexing will start at that time on the X axis.
    • To change the cycle time of the simulated multiplexed system, either drag and drop a multiplexed data point, or enter a new cycle time manually in the Cycle Time box.
    • If the graphic doesn’t work for you or simply doesn’t appear, ensure that JavaScript is enabled on your browser, and/or you may need to update your browser.

    Here is the visualization tool. Enjoy!

    For more on the future of metabolic phenotyping, see The Future of Metabolic Phenotyping!

    If you have any questions, contact me.

    * Thanks to Thomas Förster, Ph.D., Sable Systems International’s expert in-house data analysis and data presentation consultant, for creating the JavaScript application.


  • Activity Metabolism Measurements Made Easy in Metabolic Phenotyping

    One of the classic controversies in the field of metabolic science is the effect of activity on overall energy expenditure. As a comparative physiologist with a long-standing interest in energetics (and several papers published in that field), I find this controversy to be particularly strange, especially because some respectable and intelligent people will politely insist that activity has very little effect on overall energy expenditure. At the center of this controversy lies the beating heart of metabolic phenotyping.

    Analysis of data from what I’ll call “legacy” metabolic phenotyping systems can, indeed, show little if any relation between metabolic rates and activity. I’ve dealt in passing with this controversy in my blog entries “How multiplexing distorts metabolic phenotyping data” and “The future of metabolic phenotyping”. Simply put, it is difficult or impossible to correlate activity and energy expenditure in a conventional, legacy metabolic phenotyping system. However, in the new Promethion-C continuous metabolic phenotyping system, what was previously hidden or distorted is now revealed with startling clarity.

    Let me show you exactly what I mean. For this example, I will choose a measurement that most researchers would consider to be practically impossible in a metabolic phenotyping system – the accurate measurement of minimum cost of transport, which requires tracking energy expenditure with great precision and high temporal resolution, and synchronizing those data perfectly with the running speed of an animal. This is almost invariably performed one animal at a time, using a treadmill that forces the animal to run over a wide range of set, constant speeds. A metabolic measurement system measures the energy expenditure of the animal, and also records its running speed. For each animal, its running speed in meters per second is regressed against its energy expenditure in watts per kilogram. The slope of the resulting line has the units of Joules per meter per kilogram, and is known as the minimum cost of transport or MCOT. This is not an easy measurement to make, under the best of circumstances. But if it can be measured accurately in a metabolic phenotyping system, you can be certain that the data from that metabolic phenotyping system are trustworthy. Making it far less likely that you will obtain results that simply don’t make sense.

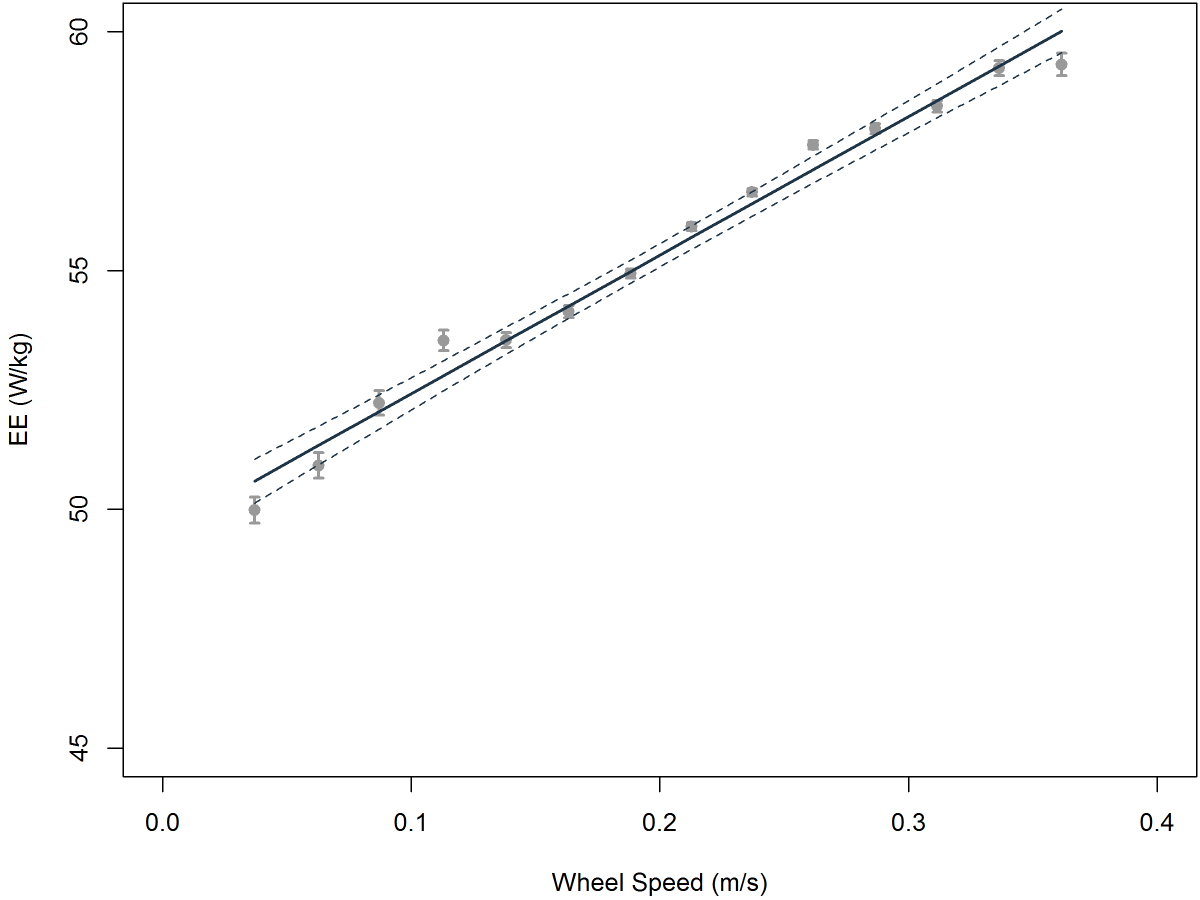
    At the Sable Systems metabolic phenotyping course in October 2-6 2012, we obtained a few nights’ worth of continuous, non-multiplexed data from several mice. We used C57BL/6J mice from Jackson Labs. Thanks to the second by second metabolic measurement capability of the Promethion-C system on multiple animals at once, and thanks to the fact that the running speed of each mouse in its running wheel was accurately measured second by second in synchrony with its metabolic data, we could correlate energy expenditure with voluntary running speed for each mouse. This process was greatly assisted by our ability to apply response correction to the metabolic data (see overview by Lighton, 2012), which was possible only because those data (a) are low in noise and (b) were acquired without multiplexing.

    And here is a typical graph of energy expenditure vs. voluntary running speed. The quality of the data is absolutely outstanding – at least as good as, if not better than, equivalent data obtained from animals under highly controlled conditions using a treadmill. The data were acquired over a night’s worth of running wheel activity. The MCOT of this particular 25 gram mouse, which is the slope of the line in the graph, was 29.0 J per meter per kilogram, and variation in its running speed explained over 98% of the variation in its energy expenditure. In the classic paper on minimum cost of transport (Taylor et al. 1982), only two of the 90+ cited studies met or exceeded that figure of merit for data quality.

    But here’s the $64,000 question. Sure, we measured the MCOTs of the mice, but are those figures believable? Are they accurate? Let’s be scientifically respectable and phrase this as a testable hypothesis. We know from Taylor at al. (1982) that there is an allometric relation between MCOT and body mass across a wide range of animal body masses. This relation, which has proven to be remarkably robust, allows us to predict the minimum cost of transport that should be measured for an animal with the body mass of our mice. Our null hypothesis is that the MCOT measured for our mice in our Promethion-C system will bear no relation to their predicted MCOT based on data in the scientific literature. This would cast serious doubt on the ability of our Promethion-C system to measure activity metabolism accurately. It may also cause such a system to show little if any correlation between activity and energy expenditure.

    This figure shows the allometric relation between MCOT and body mass in a wide variety of animals (data from Taylor et al. 1982). The gray zone shows the 95% prediction interval based on existing data. The red dot is the mean MCOT measured from our mice in the Promethion-C metabolic phenotyping system, and was calculated as the mean of nine slopes (MCOTs) each based on a night’s worth of data as shown in the previous graph. As you can see, it is solidly within the predicted range of the values measured under far more rigorous conditions – using a treadmill, at controlled speeds, under constant and highly trained human supervision, and generating a great deal of stress for the animal involved. In fact, it’s my suspicion that the stress of treadmill running leads to elevated cost of transport measurements, as I once showed in one of my far too infrequent Nature papers (Lighton and Feener, 1989). This makes the position of our mouse MCOT data, which is slightly but by no means significantly below the predicted line, all the more believable. As anyone who has run mice on a treadmill knows all too well, treadmill-running requires a lot of training for the mice and a lot of patience for the operator, and it also requires, unfortunately, incentivizing the mouse to run by placing a shock-grid at the back of the treadmill chamber. You can imagine what this does to the mouse’s stress and thus cortisol levels, which will inevitably elevate its metabolic rate. Yet here, we are obtaining superior data without requiring a treadmill, without stressing the mouse, without requiring a skilled operator’s constant attention, and we are doing so on many mice simultaneously. What’s not to love?

    Thus the null hypothesis is not only falsified, it is smashed into smithereens that daintily and prettily drift down to the floor like dandelion seeds, except that they sparkle in the moonlight.

    MCOT is an important parameter. Suddenly, it becomes practical to measure it in a metabolic phenotyping system en masse without constant, highly skilled human supervision and considerable animal stress. And if the system can measure MCOT, which is one of the most difficult metabolic parameters to measure, it can certainly make any other metabolic measurements demanded of it. Provided, of course, the metabolic phenotyping system in question is a Promethion-C. Friends don’t let friends depend on anything but Promethion for their critical data.

    If you have any questions, contact me.

     — John Lighton


    * Thanks to Thomas Förster, Ph.D., Sable Systems International’s expert in-house data analysis expert and data presentation consultant, for creating the graphs.

    Citations:

    C.R. Taylor, N.C. Heglund and G.M. Maloiy (1982) Energetics and mechanics of terrestrial locomotion. I. Metabolic energy consumption as a function of speed and body size in birds and mammals.  J Exp Biol 97, 1-21.

    J.R.B. Lighton and D.F. Feener (1989) A comparison of energetics and ventilation of desert ants during voluntary and forced locomotion. Nature 342, 174-175.

    J.R.B. Lighton (2012) “Instantaneous” metabolic measurement.  J Exp Biol 215, 1605-1606.


  • The “Deep Data Field System” in Metabolic Phenotyping

    Data from a metabolic phenotyping system can be rigidly determined by the parameters entered at the time of the experiment (as with legacy systems), or the data can be a rich mine of information, with complete post-hoc analytical flexibility (as with Promethion). The latter approach allows extraction of experimental data, the need for which was not anticipated at the time of the study. This can save serious amounts of time and money – apart from producing better science.

    Browsing through a data set produced by a Promethion metabolic phenotyping system is a fascinating experience. This is for many reasons, but one of the most interesting to me personally is the richness of detail. Because the data from all of the sensors in all of the cages are recorded once a second (together with either multiplexed or continuous metabolic data, depending on the system used), every detail of the experimental animal’s interactions with them are recorded as well. This is in stark contrast to legacy metabolic phenotyping systems, which record only a pre-digested sub-set of processed data created using black-box algorithms. In such systems, you have to pre-set the analytical constraints that determine the type of data you will obtain – for example, binning metabolic or uptake data by certain time-periods.

    The result is that Promethion data are agnostic. I stress the word because the Promethion-equipped investigator has access to the entire set of raw data from which any analyses can be derived. Although a Promethion metabolic or behavioral phenotyping system gives you helpful intermediate feedback on processed variables such as EE and RQ, the raw data are intact and can be analyzed, and re-analyzed, in any way you choose. The Promethion system, unlike legacy systems, makes no assumptions or presumptions about the questions you are asking or the way in which you are trying to answer them with your experiment. An analysis script extracts the data you need, and analysis scripts are very versatile. The standard output of a legacy metabolic phenotyping system represents only a tiny sub-set of the data available from a Promethion system (of course you can use as little or as much as you want).

    Of course, it isn’t easy to record high-resolution data from hundreds of sensors every second. That’s one reason why the legacy systems can’t do it. The other reason is more basic – if everyone is happy with legacy systems, why bother to change? I won’t dignify that reason with a reply.

    I’ll be posting examples of unexpected treasures hidden in Promethion data in due course. But, searching for a metaphor to communicate the ease of extracting novel data from these rich data-sets, I came upon a technology that shares many features with Promethion, though in a different technological world, and the parallels are so interesting I decided to share them with you.

    That other technology is the light field camera, pioneered by Lytro. It captures all of the data in the light field at which it’s pointed, just as the Promethion system does with behavioral and metabolic data. So far, it sounds like a conventional camera, just as Promethion sounds superficially like a typical metabolic or behavioral phenotyping system. But in fact there is a radical difference. Let’s explore the metaphor by treating images from a Lytro camera* as if they were extracted from a data set in the course of a scientific investigation.

    So, let’s start. You have a single image from a light field camera, or, in our metaphor, a single data file from a “data field system”, i.e. a Promethion system. You want to answer a specific scientific question, symbolized by the fellow’s face in the foreground.

    All well and good. However, as you proceed with writing your paper, you come upon another paper bearing directly on your topic, and it forces you to change the analytical focus of your study slightly. In our metaphor, the focus shifts to the woman’s face. Not a problem for a light field camera or, of course, a data field system. Just change the focus (or the analytical script) post-hoc.


    Had you been using a conventional camera, or a legacy metabolic phenotyping system, you would have had to set up the shoot again, or deal with an intolerable loss of detail. But because you are using a light field camera, or a data field system, the day is saved. No need to go to the delay, trouble and expense of re-booking a fortnight at the local metabolic phenotyping facility.

    Now for a scenario familiar to everyone who has published. Your paper’s been submitted and reviewed, but two reviewers – though favorably inclined in general – are demanding, in light of other work just published, that certain additional measurements and analyses must be made. These will normally require you to repeat the entire experiment! Or, to use our light field camera metaphor, the focus has to change to the fellow in the background. Not a problem with a Lytro light field camera:

    …And also not a problem with a Promethion data field system. No re-booking an expensive facility, derailing other projects, or re-submitting the MS to a less-fussy, lower-impact journal. Just use a new analytical script. To give you a concrete example, let’s say the referee demands that the food uptake data must be accompanied by a full meal pattern analysis with one-second granularity. With Promethion, that isn’t a problem at all. Or a complete analysis of behavioral transition probabilities between midnight and 3 a.m. before and after treatment? Null problemo. Or time budgets? A no-brainer. I could go on, but you get the point.

    Any questions or comments? Join the site membership (totally spam-free; see the bar to your left) if you have a valid email address **, and post them here. Or contact me directly if you wish.


    * The images shown above are derivative works based on public content from the Lytro site in accordance with their published policies.

    ** By which I mean commercial, academic, or identifiably yours. This restriction is imposed by hordes of would-be posters with names like hgetrew (email address gfhgfjr5566@gmail.com) who are simply forum spammers, and whose applications are heartlessly deleted.