Just a quick post to let the teeming multitudes (all three of you) know that Respirometry.org’s long stasis is at an end. I’ll be posting new content on a regular basis, much of it available nowhere else. I’ll be blogging muchly about Promethion, a new metabolic measurement system for biomedical researchers, but also on other topics.
Tag: metabolic measurement
-
The future of metabolic phenotyping

The essence of metabolic phenotyping is accurate metabolic measurement. As a matter of convenience, cost and feasibility, practically all metabolic phenotyping systems operate in a multiplexed mode, in which a single gas analysis chain is shared between multiple animals, typically 8, 10, 16 or more. Cycle times between metabolic measurements for a given animal vary widely between systems, ranging (in the case of 16 animals) from 2 minutes for an optimized Promethion-M Multiplexed metabolic phenotyping system to as much as ~45 minutes for its competitors. The result is a heavily sub-sampled data set from which much fine temporal detail is missing or distorted.
The picture above is worth a thousand words. It shows the output of a brand new Promethion-C Continuous, parallel metabolic phenotyping system. Data from one of sixteen animals (mice, strain C57BL/6J) is shown. Eight at a time were measured simultaneously, without multiplexing, and the system is capable of indefinite expansion (one pharmaceutical company has a 24-channel Promethion-C system). Click on the picture to embiggen it. Data on VCO2, food and water uptake, body mass, water loss rate etc. were also acquired synchronously but are not shown. For more on this topic, including an excellent interactive visualizationof the distortions caused by multiplexing, visit this later blog post.
The multiplexed system (red lines) was simulated from the output of the Promethion-C system*, assuming a 30 minute cycle time, which is faster than average. As you can see, the Promethion-C system (black trace) tracks each metabolic excursion by the animal, as it alternates between rest, pedestrian locomotion, and wheel running, with extraordinary fidelity. The data storage interval of the Promethion-C metabolic phenotyping system is one second for all attached sensors.
Now that Promethion-C is available, it is extremely hard to justify acquiring multiplexed metabolic phenotyping systems any longer unless cost is an overriding factor. If that is the case, Promethion-M offers the fastest cycle times available – for example, down to 2 minutes cycle time for a 16-cage system. Like all Promethion systems, Promethion-M also offers the many traceability and transparency benefits of complete raw data retention. Plus, most components of a Promethion-M system can be used in your Promethion-C system if you ever decide to upgrade.
Designing and building a “massively parallel”, continuous, multi-animal metabolic phenotyping system is far from easy. This is especially true if the system stores all of the raw data from all sensors – a requirement for good laboratory practice. The bandwidth requirements are formidable, as are the requirements for implementing suitably flexible data analysis protocols. There is no way this massive exercise in coordinated integration will work unless, as with Promethion, the manufacturer has total control over all aspects of the design of all instrumentation comprising the system. This we do. As a result, Promethion-C is up and running, in production, a documented and field-proven product with multiple installations in the field.
As the chief designer of both Promethion systems, it’s been a privilege to have the opportunity to turn my knowledge of respirometry and passion for innovation to practical use for the biomedical community!
If you have any questions, contact me.
— John Lighton
* Thanks to Thomas Förster, Ph.D., Sable Systems International’s expert in-house data analysis and data presentation consultant, for running the simulation and creating the graph.
-
Data, data, data!
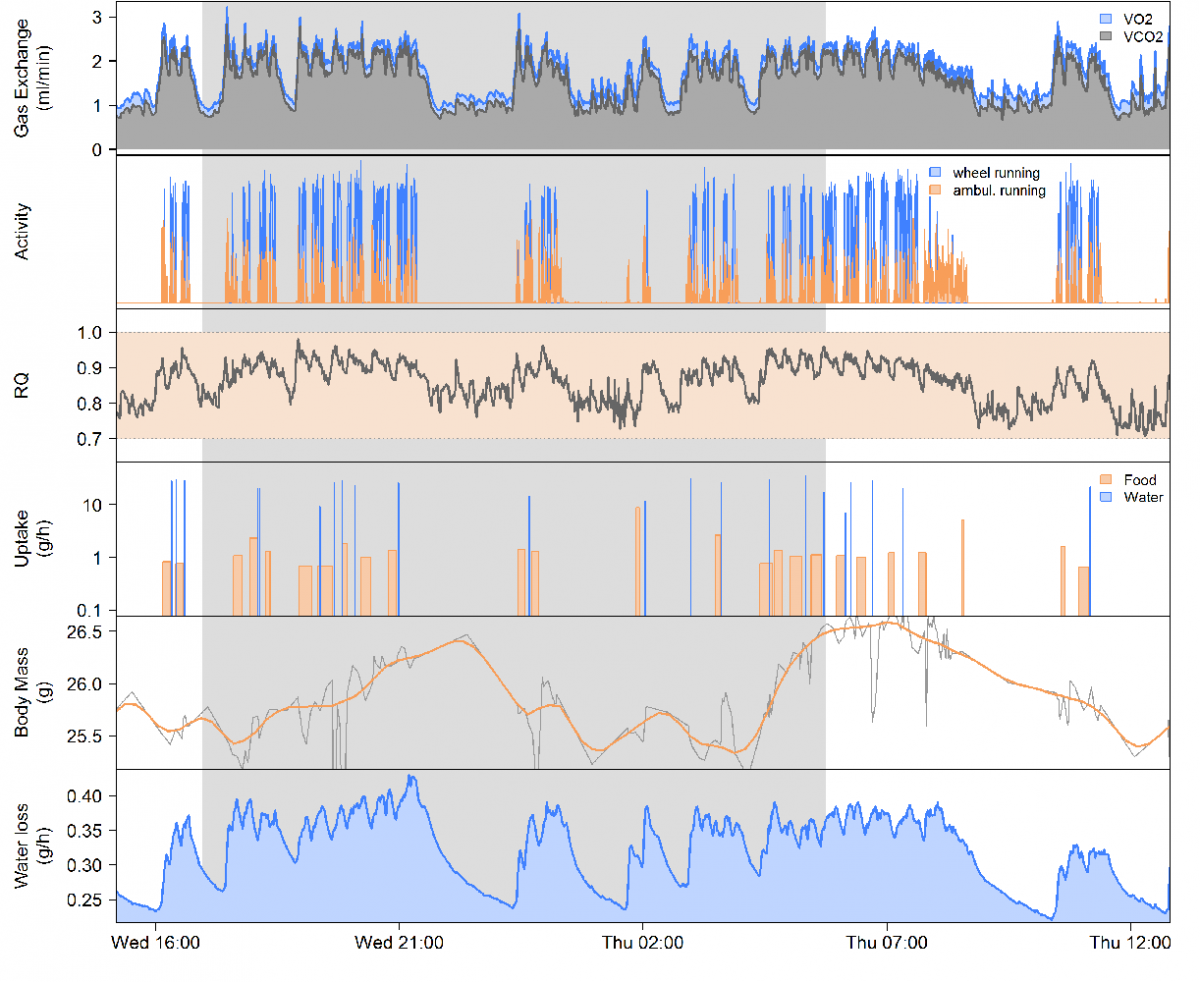
This shows a day’s worth of data from a single mouse in graphic form, recorded by a Promethion-C system for a research study on which I’m collaborating. The time resolution of the data set is one second. Loads of additional data (such as XY position and so on) didn’t make it into the graph but are waiting in the wings in case they’re called on for duty. Click on the graph* to embiggen it.

So, what’s happening? The top panel shows VO2 and VCO2 (rate of O2 consumption and CO2 production, respectively). You can see they’re quite variable, and that most of the variability is explained by the next panel, which displays wheel running and non-wheel pedestrian locomotion in blue and orange, respectively. You can see how the VO2 and VCO2 traces faithfully reflect the increased metabolic rate that accompanies locomotion. The next panel, RQ, shows the fuel that the animal is burning. It can vary from 0.7 (fueled entirely by fat) to 1.0 (fueled entirely by carbohydrates). As you can see, when the mouse is running, it shifts the fuel it is burning more towards carbohydrates. Next we have food and water uptake, then below that, the body mass of the mouse. (You might wonder how that’s measured; inside the cage there’s a cute little habitat attached to a high-resolution mass sensor, and the mouse gets weighed each time it enters and leaves the habitat. The food and water uptake sensors work in a similar, differential way). You can see how the mouse’s body weight (or body mass, to be rigorous) increases when it goes through feeding and drinking bouts. And finally, we have something that only Promethion can measure in the metabolic phenotyping arena, which is water loss rate. That’s the sum of the water the mouse ate and drank and later excreted, and the water the mouse produced metabolically. You can see how closely it tracks metabolic activity. Metabolic water production can be very significant. Would you believe that 1 gram of fat produces over a gram of metabolic water?
Just a tiny appetizer, a soupçon, of what you can get from a good metabolic phenotyping system.
— John Lighton
* Thanks to Thomas Förster, Ph.D., Sable Systems International’s expert in-house data analysis and data presentation consultant, for creating the graph.
-
Continuous Metabolic Phenotyping – How Continuous is “Continuous”?
UPDATE added June 2019: Since writing this blog post, I’ve re-thought the topic of continuous vs. multiplexed metabolic measurement! This post fails to consider the effect of the cage time constant, which substantially reduces, and sometimes entirely eliminates, the advantages of continuous vs. multiplexed metabolic measurement. I’ll be dealing with this topic in several upcoming blog posts! But in the meantime, here’s a video that explains the effect of the cage time constant on the continuous-vs.-multiplexed debate! In the meantime, it is amusing to note that our legacy metabolic phenotyping competitors have recently undergone an hysterical conversion to continuous metabolic measurement, which needless to say they are marketing in a ludicrously overhyped and misleading way because they simply do not understand the fundamentals of metabolic measurement theory.
Now on to the old article, which does NOT reflect my latest thinking on the subject. You can view it as Ediacaran. Isn’t evolution fun?
A continuous metabolic phenotyping system is required for tracking rapid changes in metabolic data. Such a metabolic phenotyping system must sample continuously from each cage in parallel. Because each cage gets its own gas analyzer system, the sampling rate can be greatly increased relative to multiplexed systems, which share a gas analyzer chain between several cages. This allows transient metabolic phenomena to be resolved. For example, responses to injections or other such treatments can be tracked with excellent temporal resolution.
For monitoring very rapid changes in metabolic rates, legacy (or, to put it less diplomatically, outmoded) metabolic phenotyping systems can be almost useless. A typical 16-animal legacy metabolic phenotyping system only samples a given cage every 10 to 60 minutes. Promethion-M metabolic phenotyping systems can cut the sampling interval down to as little as every 2 minutes (independent of the number of cages), but even that isn’t fast enough to track the rapid metabolic changes of interest to some researchers.
Continuous metabolic measurement to the rescue! At least, that’s the theory…
In practice, some metabolic phenotyping systems that claim to be “continuous” may be anything but. Caveat emptor!
In the case of the Promethion-C continuous metabolic phenotyping system, we pulled out all the stops in designing it. Decades of experience with ultra-demanding metabolic measurement scenarios went into it. And a crew of highly talented Sable Systems employees, who contributed many excellent ideas and insights of their own, helped to bring the system from theory and early prototypes into a beautifully robust, reliable solution for anyone requiring blazing-fast temporal resolution with the unique advantages of the Sable-HD high definition, deep field data field system. We’re talking a fresh metabolic sample every second. That synchronizes perfectly with all of the other data acquired by the Promethion system every second (food and water intake, body mass, position* and everything else).
Naturally enough, Promethion’s competitors are trying to get in on this act. How successfully? How do their continuous systems compare with Promethion-C?
Fortunately, I can answer that question with a direct comparison. A scientist, whose name and institution I am keeping confidential at their request, purchased a competitor’s “continuous” metabolic phenotyping system before they heard about Promethion-C. The scientist, in search of better performance, has now purchased a Promethion-C system. To quantify the difference between the two systems, the scientist set up the systems to operate in parallel, with rats, using the Promethion-C system to sub-sample the flow from the competitor’s system, which operates in the push mode (as do most legacy systems) rather than the more advanced and animal-friendly pull mode native to Promethion. This allowed a direct comparison between the two systems, sampling from the same cages at the same time in perfect synchrony, and analyzing precisely the same air flow. I made sure that the respirometry equations (as described in my book) were changed to use push, rather than pull, mode so that the Promethion analysis macro – which requires just a button-click for the user to operate, for the math-o-phobic among you – produced the correct results. The data from the competitor’s system were obtained directly from the .csv files their system produced.
Of course, after the air stream entered the two systems, it was treated differently. The competitor’s legacy technology attempted to remove water vapor from the air stream that their system analyzed, while Promethion-C welcomed the water vapor but measured it accurately so that its dilution effect could be removed mathematically and precisely (see here). This approach gives a host of benefits, including greater mechanical simplicity and reliability, access to a unique body of water-balance data (including metabolic water production), and intrinsically greater accuracy – and has been fully validated.
Comparing the two data sets was not entirely straightforward. This is because the competitor’s system acquires samples only once every 60 seconds (!), and outputs a 0 each time the system baseline is measured. You can see the result in this graph – rather ugly and low-resolution, in my opinion; in fact, only 1/60th the temporal resolution of Promethion-C system and just slightly faster than a multiplexed Promethion-M system.
 Fortunately Expedata, the Promethion data analysis environment, is extremely powerful and can automatically remove the periodic down-to-zero spikes in the competitor’s data by interpolating across them, and can then import the cleaned data into a Promethion-C recording made over the same time period. (Expedata can import date-and time-stamped recordings into Promethion data files, and if necessary interpolate them to match Promethion’s much higher, one-second sampling interval.)
 You can see the results in the figure to the right. Click on it to enlarge it.
As you can see, the results are quite similar when data do not change rapidly. Rapid data changes cause a larger disparity between the Promethion-C data and the competition, with the competition showing a tendency to under-estimate VO2 when d(VO2)/dt is negative. But generally the two systems give similar results, though with much finer detail in the case of Promethion-C.
What about more rapid changes in data?As the figure to the left shows, the two systems start to diverge very significantly when accurate responses to rapid data changes are required.
 As you can see, the scientist made a total of 4 manipulations to the cage during the course of this graph, which involved replacing hoppers and also removing and weighing the animal. The Promethion-C system followed the rapid changes with far greater fidelity than the competitor’s “continuous” system. Remember that the two systems are analyzing exactly the same air streams! For example, each of the manipulations is clearly visible in the Promethion-C recording, but is either entirely invisible or greatly distorted in the recording from the competitor’s system. In addition, the spike in VO2 about 15 minutes into the recording, the double spike about 55 minutes into the recording, and in general the detailed fine structure of the metabolic signal, are invisible to the competitor’s system.
Of still greater concern is the difference in the RER data between the two systems. A typical section is shown here.
 As you saw in the previous graphs, the VO2 readings from the two systems are quite closely matched. However, this is not the case in the VCO2 readings, which are divergent to the point that the competitor’s system gives non-physiological RERs (unless, of course, de novo lipogenesis is occurring in this rat, which is unlikely under the conditions of the experiment). The Promethion-C system, on the other hand, gives eminently reasonable RERs. This is especially interesting in light of this competitor’s vocal assertions that it is not possible to measure RERs accurately in the presence of water vapor!
Now, it is certainly possible that the competitor’s CO2 analyzers may have been mis-calibrated. I will give them the benefit of the doubt. Though, I have to admit that as a metabolic measurement and gas analysis expert, I am disturbed by the calibration technique I have heard that this competitor apparently uses, namely using two different concentrations of CO2, neither of which is zero. Really strange, and suggesting little faith in the linearity of their CO2 analyzer. But hey, it takes all kinds.
There is a yawning gulf between the performances of the two systems – especially considering that their prices are very similar. Paying a premium for a competitor’s “continuous” system using legacy technology when you can get practically equivalent performance from a Promethion-M multiplexed system at a much lower price, is not rational. Likewise, a 60-fold temporal resolution advantage with Promethion-C at about the same price-point suggests that Promethion-C is the rational choice if you have a need for speed.
For many years, my scientific research on small animals took me to the ragged, bleeding and stabby outer edge of what is possible with modern gas analyzer technology, forcing me to learn the theory and practice of designing gas analysis and metabolic measurement systems with the extreme resolution required for flow-through respirometry. That’s one reason why Sable Systems O2, CO2 and water vapor analyzers are prized for their resolution by the pickiest users in the world, including climatological institutes, NIST and NASA. Promethion, whether of the multiplexed or the continuous variety, is the result of decades of blood, sweat and research experience, rather than a system designed to spec by consulting engineers using industrial process-control analyzers and hired by non-scientists (nice though non-scientists and consulting engineers may be).
When Sable Systems says “By scientists, For scientists”, we mean it, and it shows.
* Some sensors, such as the XYZ open-field array that senses activity, position and rearing, internally sample at a much higher rate – 400 Hz for the XY array, for example – and transmit intelligently summarized data (beam breaks, centroid positions) every second.