Tag: food uptake

  • Data, data, data!

    This shows a day’s worth of data from a single mouse in graphic form, recorded by a Promethion-C system for a research study on which I’m collaborating. The time resolution of the data set is one second. Loads of additional data (such as XY position and so on) didn’t make it into the graph but are waiting in the wings in case they’re called on for duty. Click on the graph* to embiggen it.

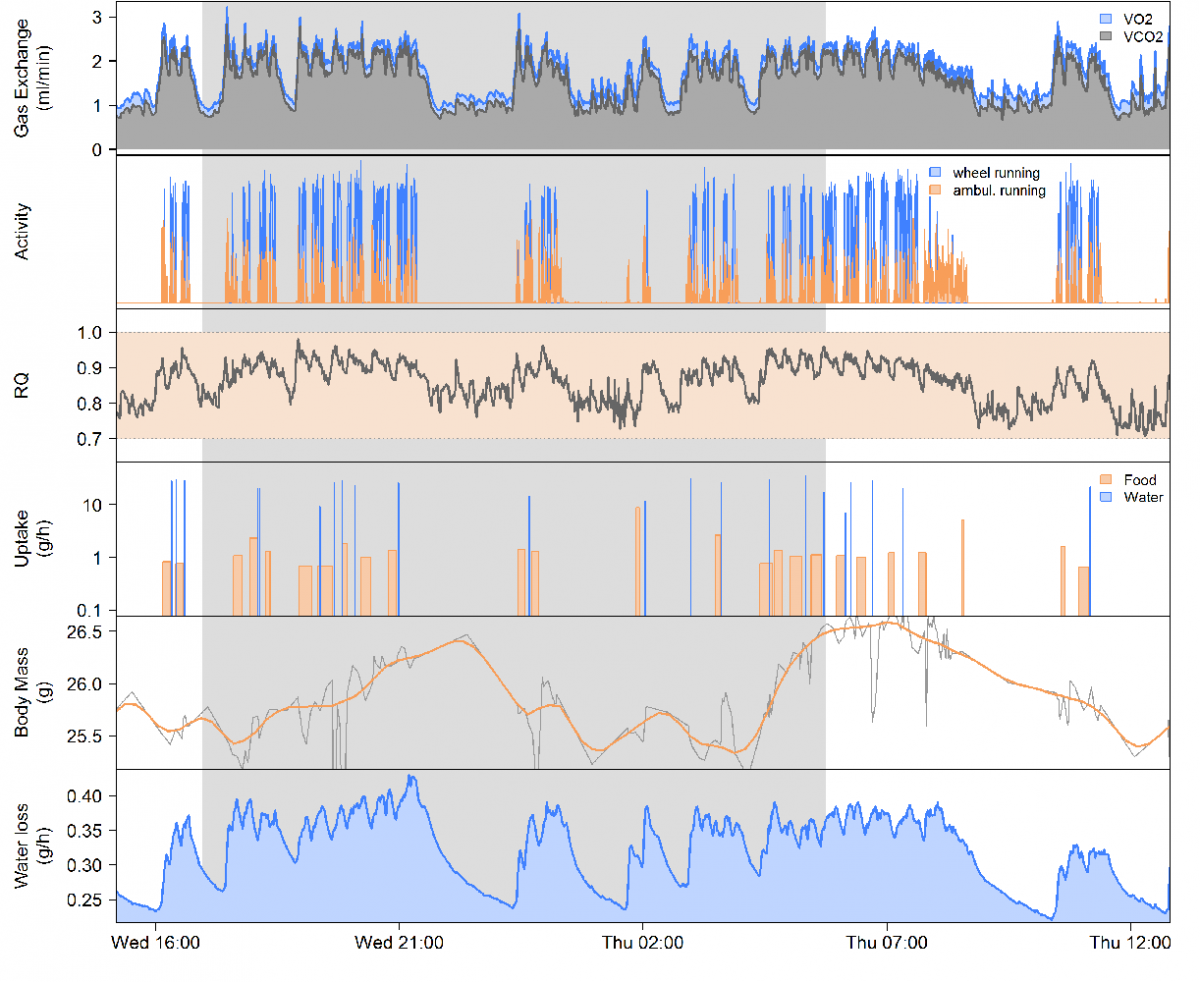
    So, what’s happening? The top panel shows VO2 and VCO2 (rate of O2 consumption and CO2 production, respectively). You can see they’re quite variable, and that most of the variability is explained by the next panel, which displays wheel running and non-wheel pedestrian locomotion in blue and orange, respectively. You can see how the VO2 and VCO2 traces faithfully reflect the increased metabolic rate that accompanies locomotion. The next panel, RQ, shows the fuel that the animal is burning. It can vary from 0.7 (fueled entirely by fat) to 1.0 (fueled entirely by carbohydrates). As you can see, when the mouse is running, it shifts the fuel it is burning more towards carbohydrates. Next we have food and water uptake, then below that, the body mass of the mouse. (You might wonder how that’s measured; inside the cage there’s a cute little habitat attached to a high-resolution mass sensor, and the mouse gets weighed each time it enters and leaves the habitat. The food and water uptake sensors work in a similar, differential way). You can see how the mouse’s body weight (or body mass, to be rigorous) increases when it goes through feeding and drinking bouts. And finally, we have something that only Promethion can measure in the metabolic phenotyping arena, which is water loss rate. That’s the sum of the water the mouse ate and drank and later excreted, and the water the mouse produced metabolically. You can see how closely it tracks metabolic activity. Metabolic water production can be very significant. Would you believe that 1 gram of fat produces over a gram of metabolic water?

    Just a tiny appetizer, a soupçon, of what you can get from a good metabolic phenotyping system.

    — John Lighton

    * Thanks to Thomas Förster, Ph.D., Sable Systems International’s expert in-house data analysis and data presentation consultant, for creating the graph.

  • Measuring food uptake differentially

    Let’s say you need to measure the food uptake of an experimental animal, which of course could mean any creature, including you. For the sake of simplicity, imagine a mouse or a rat feeding intermittently from a food hopper.

    You’d think that all you needed to do was weigh the hopper periodically, such as at the start and end of each 24-hour cycle, and see how much its mass decreases. You’d be right, in a sense. That will indeed measure the change in food mass over that period. But if you think that the change in mass is an accurate representation of the amount of food the critter ate, you might be very wrong.

    This is because most food, including rat or mouse chow, is hygroscopic. It absorbs water from the water vapor in the air to an extent roughly proportional to relative humidity. And relative humidity is anything but constant, particularly inside a cage. As a result, neither is food mass.

    To get accurate food uptake figures, you need to measure differentially. In other words, food uptake must be calculated from the difference in food hopper masses just before and just after each feeding event. This figure* (where d is food hopper mass) illustrates the point.

    As you can see, a feeding event corresponds to a large increase in the variance of the measured food hopper mass. A good food uptake calculation algorithm, such as the one used by Promethion, searches for sections of stable mass readings immediately before and after each such event. Then it compares those readings and tests them for statistical significance. If a significant difference is found, the event is designated as a food uptake event. If not – and a surprising number of interactions with the food hopper don’t result in significant food uptake – then it’s ignored.

    As a result, slow changes in hopper mass resulting from fluctuations in relative humidity no longer distort food uptake data.

    True, but analyzing the problem at a deeper level, the mass of food that is eaten, however accurately it’s measured, still reflects the sum of two partitions:

    1. The dry weight of the food that is eaten
    2. The weight of water associated with the food

    The water content of typical mouse or rat chow is about 10-15%, so the error can be significant. Dry food mass would be a much better measure of food uptake.

    Funny you should say that. Because the Promethion system (unlike any other food uptake measurement or metabolic phenotyping system) measures water vapor partial pressure in the air pulled from the cage, it is possible, knowing this, to back-calculate food mass to its “dry” state, mathematically. All that is required is a good characterization of the chow’s mass versus ambient water vapor partial pressure.

    Not a single researcher anywhere in the world is yet doing this. But it’s possible (though only with Promethion). I wonder who will be the first to fill this vacuum?

    — John Lighton

     * Thanks to Thomas Förster, Ph.D., Sable Systems International’s expert in-house data analysis and data presentation consultant, for creating the graph.

  • Distinguishing individual food uptake in communally housed mice using RFID

    Mice are communal beasts, just like rats. They live in groups, and separating them – as required for measuring food intake / food uptake or energy expenditure – stresses them, elevating cortisol levels and leading to to a host of unwanted side-effects. Using the right technology, however, obtaining separate food uptake recordings from communally housed mice is straightforward. This short article demonstrates just such an application, combining a Promethion mass measurement module (2 mg resolution) with RFID.

    To identify an animal using RFID, a simple and quick injection of a subdermal PIT (Passive Integrated Transponder) tag, about the size of a grain of rice, is required. There are two broad types of PIT tags; half duplex (HDX) and full duplex (FDX). For a variety of reasons, HDX PIT tags are preferable. Any vet or trained animal care technician can insert the tag. (A number of people are experimenting with them too.)

    The principle of HDX RFID PIT tags is simple. A nearby coil periodically generates an EMF field at (typically) 134 kHz. The PIT tag contains a resonant circuit that charges a capacitor while the coil is generating its EMF field. Then the coil switches from transmitting to receiving mode; the PIT tag uses the energy stored in the capacitor to generate its own EMF field, which transmits a unique ID code back to the coil. And voilà, RFID! (Super-over-simplified, you understand.)

    So, we can separate individual mice easily. But what about food uptake? Well, Promethion has a unique mass sensor based, like a lab balance, on a load cell, that allows extremely precise food uptake measurements. You can read about the principle here.

    A little simple design work and a short spell with a lasercutter resulted in a box that held the mass sensor and food hopper, and restricted access to the food hopper to one mouse at a time via a tube just wide enough for a single mouse to enter. The tube that limited access was adjacent to an RFID reader of our own design. (Existing commercial RFID readers are limiting and cumbersome; I frown on them.)

    The graph to the left is worth a thousand words. Click to embiggen it. The red trace corresponds to the ID of the mouse; either absent (no mouse in the feeder) or at two different levels, one corresponding to the ID of one mouse, the other to the ID of her nestmate. The blue trace corresponds to the mass of the hopper, which clearly shows the disturbance caused by feeding, and the change in food hopper mass before and after each feeding event by each mouse.

    As you can see, separating food uptake / intake data for each mouse is easy. The precise uptake amount of food consumed during each feeding event is easily and automatically obtained, together with meal duration and unique-to-Promethion data such as the force that the mouse applied to the hopper during the feeding event. Using this RFID-based technique, subtle differences between mice can be teased apart from the stress of isolation. Better for the mouse, and thus – because an unstressed mouse is a better experimental subject – better for research too.

    What about separating the metabolic rates (energy expenditures) of individual mice in a communal setting? All I can say is, stay tuned.