One of the classic controversies in the field of metabolic science is the effect of activity on overall energy expenditure. As a comparative physiologist with a long-standing interest in energetics (and several papers published in that field), I find this controversy to be particularly strange, especially because some respectable and intelligent people will politely insist that activity has very little effect on overall energy expenditure. At the center of this controversy lies the beating heart of metabolic phenotyping.
 Analysis of data from what I’ll call “legacy” metabolic phenotyping systems can, indeed, show little if any relation between metabolic rates and activity. I’ve dealt in passing with this controversy in my blog entries “How multiplexing distorts metabolic phenotyping data” and “The future of metabolic phenotyping”. Simply put, it is difficult or impossible to correlate activity and energy expenditure in a conventional, legacy metabolic phenotyping system. However, in the new Promethion-C continuous metabolic phenotyping system, what was previously hidden or distorted is now revealed with startling clarity.
Let me show you exactly what I mean. For this example, I will choose a measurement that most researchers would consider to be practically impossible in a metabolic phenotyping system – the accurate measurement of minimum cost of transport, which requires tracking energy expenditure with great precision and high temporal resolution, and synchronizing those data perfectly with the running speed of an animal. This is almost invariably performed one animal at a time, using a treadmill that forces the animal to run over a wide range of set, constant speeds. A metabolic measurement system measures the energy expenditure of the animal, and also records its running speed. For each animal, its running speed in meters per second is regressed against its energy expenditure in watts per kilogram. The slope of the resulting line has the units of Joules per meter per kilogram, and is known as the minimum cost of transport or MCOT. This is not an easy measurement to make, under the best of circumstances. But if it can be measured accurately in a metabolic phenotyping system, you can be certain that the data from that metabolic phenotyping system are trustworthy. Making it far less likely that you will obtain results that simply don’t make sense.
 At the Sable Systems metabolic phenotyping course in October 2-6 2012, we obtained a few nights’ worth of continuous, non-multiplexed data from several mice. We used C57BL/6J mice from Jackson Labs. Thanks to the second by second metabolic measurement capability of the Promethion-C system on multiple animals at once, and thanks to the fact that the running speed of each mouse in its running wheel was accurately measured second by second in synchrony with its metabolic data, we could correlate energy expenditure with voluntary running speed for each mouse. This process was greatly assisted by our ability to apply response correction to the metabolic data (see overview by Lighton, 2012), which was possible only because those data (a) are low in noise and (b) were acquired without multiplexing.
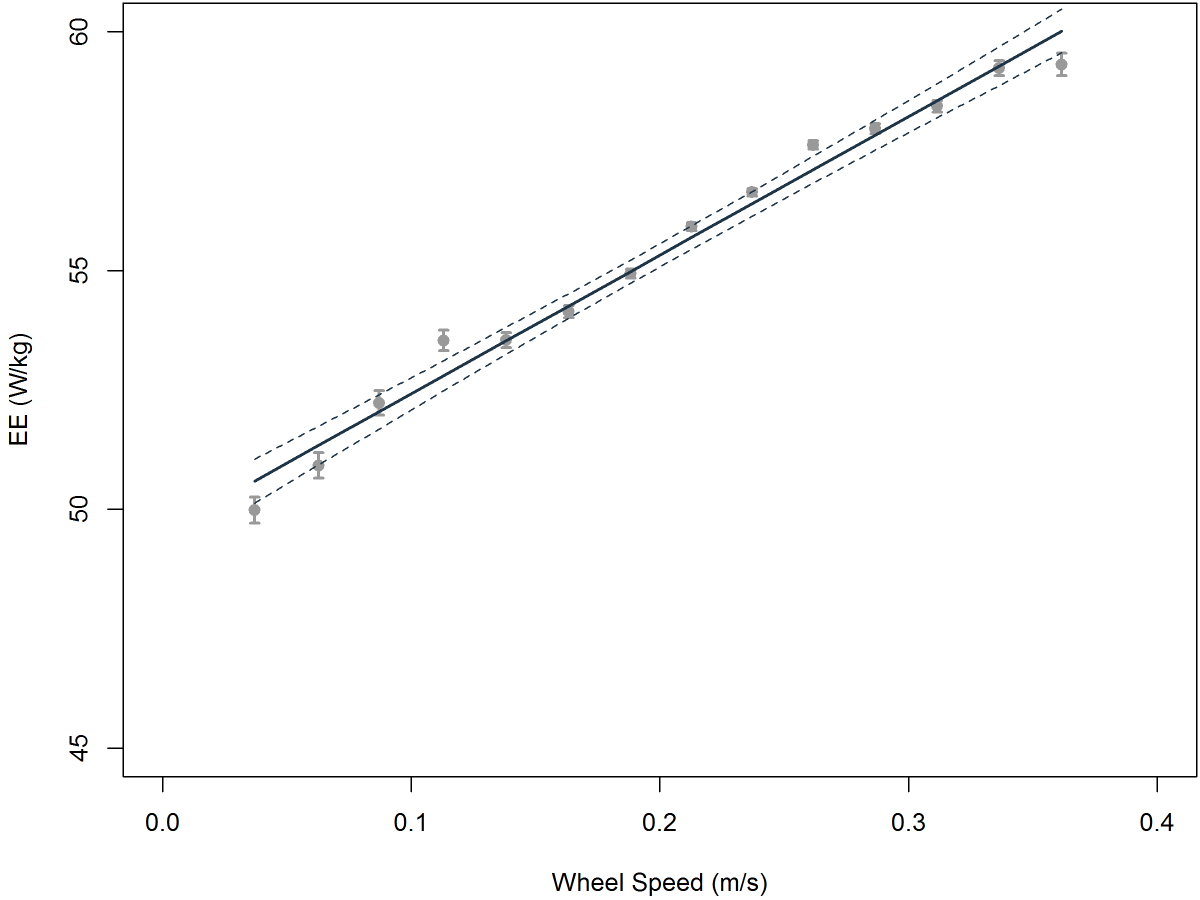 And here is a typical graph of energy expenditure vs. voluntary running speed. The quality of the data is absolutely outstanding – at least as good as, if not better than, equivalent data obtained from animals under highly controlled conditions using a treadmill. The data were acquired over a night’s worth of running wheel activity. The MCOT of this particular 25 gram mouse, which is the slope of the line in the graph, was 29.0 J per meter per kilogram, and variation in its running speed explained over 98% of the variation in its energy expenditure. In the classic paper on minimum cost of transport (Taylor et al. 1982), only two of the 90+ cited studies met or exceeded that figure of merit for data quality.
But here’s the $64,000 question. Sure, we measured the MCOTs of the mice, but are those figures believable? Are they accurate? Let’s be scientifically respectable and phrase this as a testable hypothesis. We know from Taylor at al. (1982) that there is an allometric relation between MCOT and body mass across a wide range of animal body masses. This relation, which has proven to be remarkably robust, allows us to predict the minimum cost of transport that should be measured for an animal with the body mass of our mice. Our null hypothesis is that the MCOT measured for our mice in our Promethion-C system will bear no relation to their predicted MCOT based on data in the scientific literature. This would cast serious doubt on the ability of our Promethion-C system to measure activity metabolism accurately. It may also cause such a system to show little if any correlation between activity and energy expenditure.
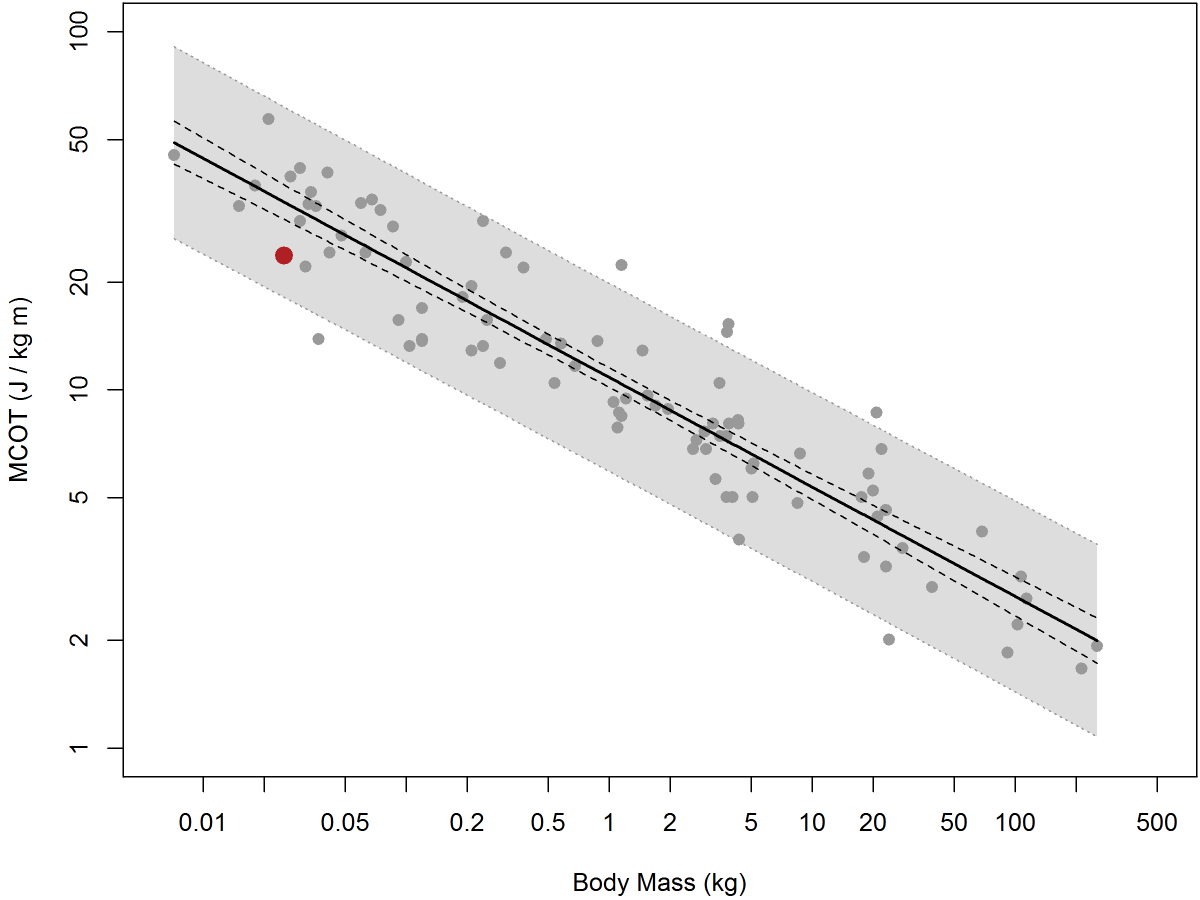 This figure shows the allometric relation between MCOT and body mass in a wide variety of animals (data from Taylor et al. 1982). The gray zone shows the 95% prediction interval based on existing data. The red dot is the mean MCOT measured from our mice in the Promethion-C metabolic phenotyping system, and was calculated as the mean of nine slopes (MCOTs) each based on a night’s worth of data as shown in the previous graph. As you can see, it is solidly within the predicted range of the values measured under far more rigorous conditions – using a treadmill, at controlled speeds, under constant and highly trained human supervision, and generating a great deal of stress for the animal involved. In fact, it’s my suspicion that the stress of treadmill running leads to elevated cost of transport measurements, as I once showed in one of my far too infrequent Nature papers (Lighton and Feener, 1989). This makes the position of our mouse MCOT data, which is slightly but by no means significantly below the predicted line, all the more believable. As anyone who has run mice on a treadmill knows all too well, treadmill-running requires a lot of training for the mice and a lot of patience for the operator, and it also requires, unfortunately, incentivizing the mouse to run by placing a shock-grid at the back of the treadmill chamber. You can imagine what this does to the mouse’s stress and thus cortisol levels, which will inevitably elevate its metabolic rate. Yet here, we are obtaining superior data without requiring a treadmill, without stressing the mouse, without requiring a skilled operator’s constant attention, and we are doing so on many mice simultaneously. What’s not to love?
Thus the null hypothesis is not only falsified, it is smashed into smithereens that daintily and prettily drift down to the floor like dandelion seeds, except that they sparkle in the moonlight.
MCOT is an important parameter. Suddenly, it becomes practical to measure it in a metabolic phenotyping system en masse without constant, highly skilled human supervision and considerable animal stress. And if the system can measure MCOT, which is one of the most difficult metabolic parameters to measure, it can certainly make any other metabolic measurements demanded of it. Provided, of course, the metabolic phenotyping system in question is a Promethion-C. Friends don’t let friends depend on anything but Promethion for their critical data.
If you have any questions, contact me.
— John Lighton
* Thanks to Thomas Förster, Ph.D., Sable Systems International’s expert in-house data analysis expert and data presentation consultant, for creating the graphs.
Citations:
C.R. Taylor, N.C. Heglund and G.M. Maloiy (1982) Energetics and mechanics of terrestrial locomotion. I. Metabolic energy consumption as a function of speed and body size in birds and mammals. J Exp Biol 97, 1-21.
J.R.B. Lighton and D.F. Feener (1989) A comparison of energetics and ventilation of desert ants during voluntary and forced locomotion. Nature 342, 174-175.
J.R.B. Lighton (2012) “Instantaneous” metabolic measurement. J Exp Biol 215, 1605-1606.


