Author: 146649pwpadmin

  • Activity Metabolism Measurements Made Easy in Metabolic Phenotyping

    One of the classic controversies in the field of metabolic science is the effect of activity on overall energy expenditure. As a comparative physiologist with a long-standing interest in energetics (and several papers published in that field), I find this controversy to be particularly strange, especially because some respectable and intelligent people will politely insist that activity has very little effect on overall energy expenditure. At the center of this controversy lies the beating heart of metabolic phenotyping.

    Analysis of data from what I’ll call “legacy” metabolic phenotyping systems can, indeed, show little if any relation between metabolic rates and activity. I’ve dealt in passing with this controversy in my blog entries “How multiplexing distorts metabolic phenotyping data” and “The future of metabolic phenotyping”. Simply put, it is difficult or impossible to correlate activity and energy expenditure in a conventional, legacy metabolic phenotyping system. However, in the new Promethion-C continuous metabolic phenotyping system, what was previously hidden or distorted is now revealed with startling clarity.

    Let me show you exactly what I mean. For this example, I will choose a measurement that most researchers would consider to be practically impossible in a metabolic phenotyping system – the accurate measurement of minimum cost of transport, which requires tracking energy expenditure with great precision and high temporal resolution, and synchronizing those data perfectly with the running speed of an animal. This is almost invariably performed one animal at a time, using a treadmill that forces the animal to run over a wide range of set, constant speeds. A metabolic measurement system measures the energy expenditure of the animal, and also records its running speed. For each animal, its running speed in meters per second is regressed against its energy expenditure in watts per kilogram. The slope of the resulting line has the units of Joules per meter per kilogram, and is known as the minimum cost of transport or MCOT. This is not an easy measurement to make, under the best of circumstances. But if it can be measured accurately in a metabolic phenotyping system, you can be certain that the data from that metabolic phenotyping system are trustworthy. Making it far less likely that you will obtain results that simply don’t make sense.

    At the Sable Systems metabolic phenotyping course in October 2-6 2012, we obtained a few nights’ worth of continuous, non-multiplexed data from several mice. We used C57BL/6J mice from Jackson Labs. Thanks to the second by second metabolic measurement capability of the Promethion-C system on multiple animals at once, and thanks to the fact that the running speed of each mouse in its running wheel was accurately measured second by second in synchrony with its metabolic data, we could correlate energy expenditure with voluntary running speed for each mouse. This process was greatly assisted by our ability to apply response correction to the metabolic data (see overview by Lighton, 2012), which was possible only because those data (a) are low in noise and (b) were acquired without multiplexing.
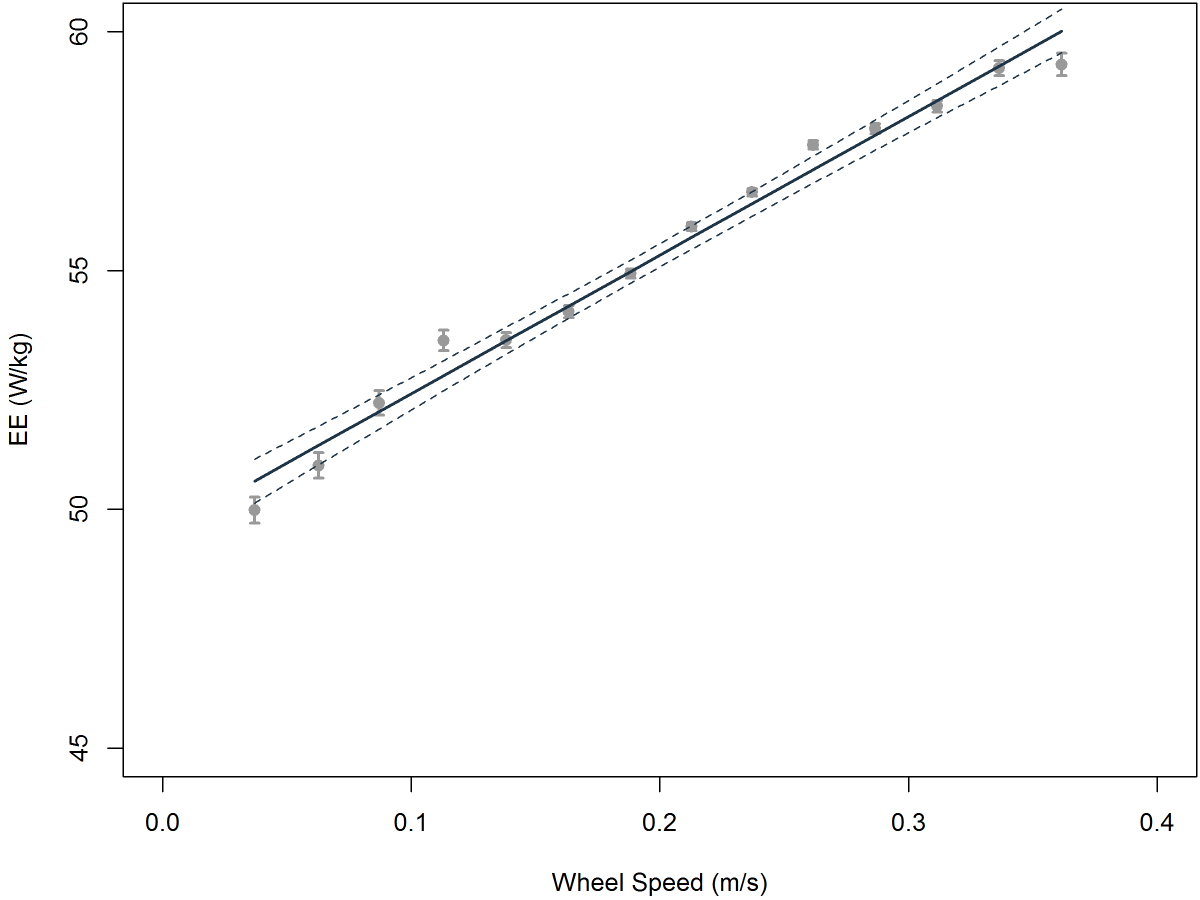
    And here is a typical graph of energy expenditure vs. voluntary running speed. The quality of the data is absolutely outstanding – at least as good as, if not better than, equivalent data obtained from animals under highly controlled conditions using a treadmill. The data were acquired over a night’s worth of running wheel activity. The MCOT of this particular 25 gram mouse, which is the slope of the line in the graph, was 29.0 J per meter per kilogram, and variation in its running speed explained over 98% of the variation in its energy expenditure. In the classic paper on minimum cost of transport (Taylor et al. 1982), only two of the 90+ cited studies met or exceeded that figure of merit for data quality.

    But here’s the $64,000 question. Sure, we measured the MCOTs of the mice, but are those figures believable? Are they accurate? Let’s be scientifically respectable and phrase this as a testable hypothesis. We know from Taylor at al. (1982) that there is an allometric relation between MCOT and body mass across a wide range of animal body masses. This relation, which has proven to be remarkably robust, allows us to predict the minimum cost of transport that should be measured for an animal with the body mass of our mice. Our null hypothesis is that the MCOT measured for our mice in our Promethion-C system will bear no relation to their predicted MCOT based on data in the scientific literature. This would cast serious doubt on the ability of our Promethion-C system to measure activity metabolism accurately. It may also cause such a system to show little if any correlation between activity and energy expenditure.
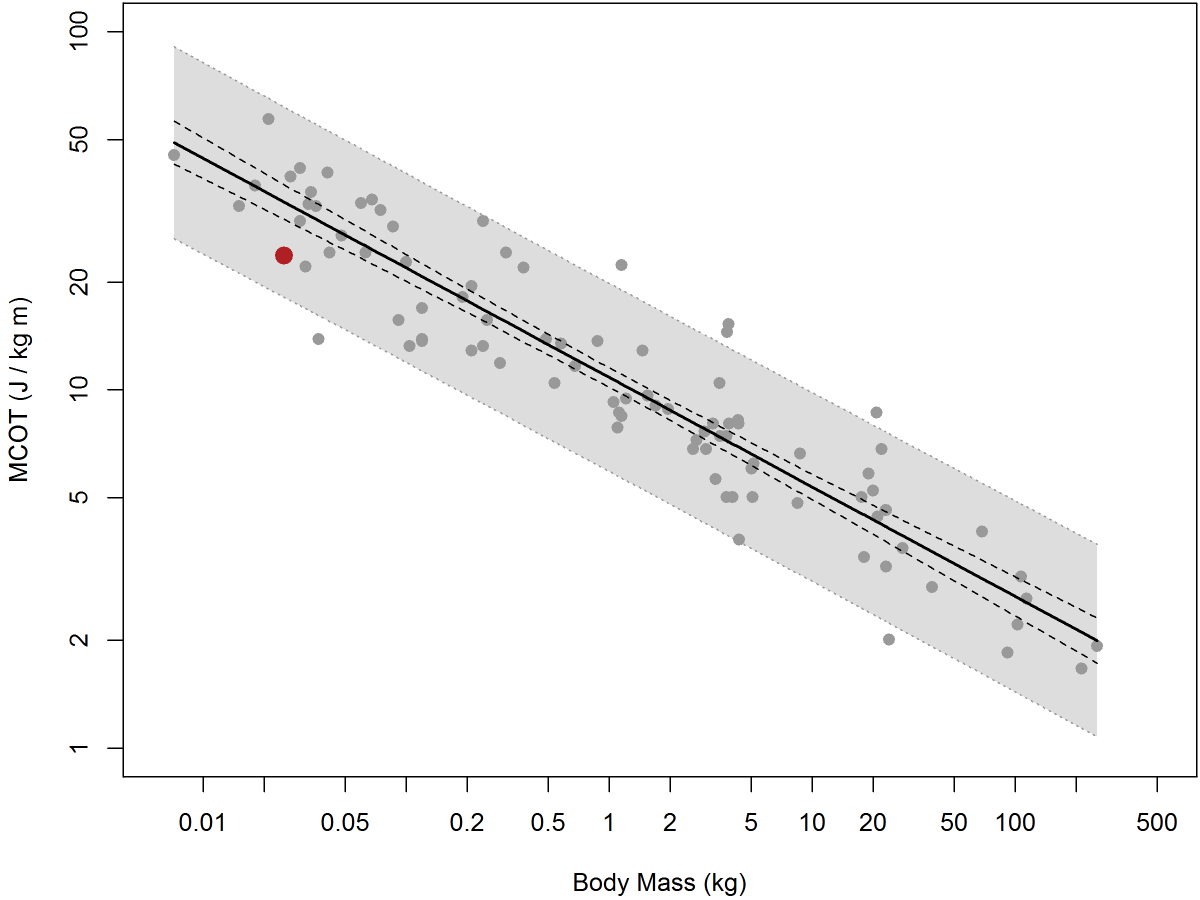
    This figure shows the allometric relation between MCOT and body mass in a wide variety of animals (data from Taylor et al. 1982). The gray zone shows the 95% prediction interval based on existing data. The red dot is the mean MCOT measured from our mice in the Promethion-C metabolic phenotyping system, and was calculated as the mean of nine slopes (MCOTs) each based on a night’s worth of data as shown in the previous graph. As you can see, it is solidly within the predicted range of the values measured under far more rigorous conditions – using a treadmill, at controlled speeds, under constant and highly trained human supervision, and generating a great deal of stress for the animal involved. In fact, it’s my suspicion that the stress of treadmill running leads to elevated cost of transport measurements, as I once showed in one of my far too infrequent Nature papers (Lighton and Feener, 1989). This makes the position of our mouse MCOT data, which is slightly but by no means significantly below the predicted line, all the more believable. As anyone who has run mice on a treadmill knows all too well, treadmill-running requires a lot of training for the mice and a lot of patience for the operator, and it also requires, unfortunately, incentivizing the mouse to run by placing a shock-grid at the back of the treadmill chamber. You can imagine what this does to the mouse’s stress and thus cortisol levels, which will inevitably elevate its metabolic rate. Yet here, we are obtaining superior data without requiring a treadmill, without stressing the mouse, without requiring a skilled operator’s constant attention, and we are doing so on many mice simultaneously. What’s not to love?

    Thus the null hypothesis is not only falsified, it is smashed into smithereens that daintily and prettily drift down to the floor like dandelion seeds, except that they sparkle in the moonlight.

    MCOT is an important parameter. Suddenly, it becomes practical to measure it in a metabolic phenotyping system en masse without constant, highly skilled human supervision and considerable animal stress. And if the system can measure MCOT, which is one of the most difficult metabolic parameters to measure, it can certainly make any other metabolic measurements demanded of it. Provided, of course, the metabolic phenotyping system in question is a Promethion-C. Friends don’t let friends depend on anything but Promethion for their critical data.

    If you have any questions, contact me.

     — John Lighton


    * Thanks to Thomas Förster, Ph.D., Sable Systems International’s expert in-house data analysis expert and data presentation consultant, for creating the graphs.

    Citations:

    C.R. Taylor, N.C. Heglund and G.M. Maloiy (1982) Energetics and mechanics of terrestrial locomotion. I. Metabolic energy consumption as a function of speed and body size in birds and mammals.  J Exp Biol 97, 1-21.

    J.R.B. Lighton and D.F. Feener (1989) A comparison of energetics and ventilation of desert ants during voluntary and forced locomotion. Nature 342, 174-175.

    J.R.B. Lighton (2012) “Instantaneous” metabolic measurement.  J Exp Biol 215, 1605-1606.


  • The “Deep Data Field System” in Metabolic Phenotyping

    Data from a metabolic phenotyping system can be rigidly determined by the parameters entered at the time of the experiment (as with legacy systems), or the data can be a rich mine of information, with complete post-hoc analytical flexibility (as with Promethion). The latter approach allows extraction of experimental data, the need for which was not anticipated at the time of the study. This can save serious amounts of time and money – apart from producing better science.

    Browsing through a data set produced by a Promethion metabolic phenotyping system is a fascinating experience. This is for many reasons, but one of the most interesting to me personally is the richness of detail. Because the data from all of the sensors in all of the cages are recorded once a second (together with either multiplexed or continuous metabolic data, depending on the system used), every detail of the experimental animal’s interactions with them are recorded as well. This is in stark contrast to legacy metabolic phenotyping systems, which record only a pre-digested sub-set of processed data created using black-box algorithms. In such systems, you have to pre-set the analytical constraints that determine the type of data you will obtain – for example, binning metabolic or uptake data by certain time-periods.

    The result is that Promethion data are agnostic. I stress the word because the Promethion-equipped investigator has access to the entire set of raw data from which any analyses can be derived. Although a Promethion metabolic or behavioral phenotyping system gives you helpful intermediate feedback on processed variables such as EE and RQ, the raw data are intact and can be analyzed, and re-analyzed, in any way you choose. The Promethion system, unlike legacy systems, makes no assumptions or presumptions about the questions you are asking or the way in which you are trying to answer them with your experiment. An analysis script extracts the data you need, and analysis scripts are very versatile. The standard output of a legacy metabolic phenotyping system represents only a tiny sub-set of the data available from a Promethion system (of course you can use as little or as much as you want).

    Of course, it isn’t easy to record high-resolution data from hundreds of sensors every second. That’s one reason why the legacy systems can’t do it. The other reason is more basic – if everyone is happy with legacy systems, why bother to change? I won’t dignify that reason with a reply.

    I’ll be posting examples of unexpected treasures hidden in Promethion data in due course. But, searching for a metaphor to communicate the ease of extracting novel data from these rich data-sets, I came upon a technology that shares many features with Promethion, though in a different technological world, and the parallels are so interesting I decided to share them with you.

    That other technology is the light field camera, pioneered by Lytro. It captures all of the data in the light field at which it’s pointed, just as the Promethion system does with behavioral and metabolic data. So far, it sounds like a conventional camera, just as Promethion sounds superficially like a typical metabolic or behavioral phenotyping system. But in fact there is a radical difference. Let’s explore the metaphor by treating images from a Lytro camera* as if they were extracted from a data set in the course of a scientific investigation.

    So, let’s start. You have a single image from a light field camera, or, in our metaphor, a single data file from a “data field system”, i.e. a Promethion system. You want to answer a specific scientific question, symbolized by the fellow’s face in the foreground.

    All well and good. However, as you proceed with writing your paper, you come upon another paper bearing directly on your topic, and it forces you to change the analytical focus of your study slightly. In our metaphor, the focus shifts to the woman’s face. Not a problem for a light field camera or, of course, a data field system. Just change the focus (or the analytical script) post-hoc.


    Had you been using a conventional camera, or a legacy metabolic phenotyping system, you would have had to set up the shoot again, or deal with an intolerable loss of detail. But because you are using a light field camera, or a data field system, the day is saved. No need to go to the delay, trouble and expense of re-booking a fortnight at the local metabolic phenotyping facility.

    Now for a scenario familiar to everyone who has published. Your paper’s been submitted and reviewed, but two reviewers – though favorably inclined in general – are demanding, in light of other work just published, that certain additional measurements and analyses must be made. These will normally require you to repeat the entire experiment! Or, to use our light field camera metaphor, the focus has to change to the fellow in the background. Not a problem with a Lytro light field camera:

    …And also not a problem with a Promethion data field system. No re-booking an expensive facility, derailing other projects, or re-submitting the MS to a less-fussy, lower-impact journal. Just use a new analytical script. To give you a concrete example, let’s say the referee demands that the food uptake data must be accompanied by a full meal pattern analysis with one-second granularity. With Promethion, that isn’t a problem at all. Or a complete analysis of behavioral transition probabilities between midnight and 3 a.m. before and after treatment? Null problemo. Or time budgets? A no-brainer. I could go on, but you get the point.

    Any questions or comments? Join the site membership (totally spam-free; see the bar to your left) if you have a valid email address **, and post them here. Or contact me directly if you wish.


    * The images shown above are derivative works based on public content from the Lytro site in accordance with their published policies.

    ** By which I mean commercial, academic, or identifiably yours. This restriction is imposed by hordes of would-be posters with names like hgetrew (email address gfhgfjr5566@gmail.com) who are simply forum spammers, and whose applications are heartlessly deleted.


  • A solution for bulk photosynthetic efficiency screening

    Sometimes strange ideas come into my head. Most of the time, being too busy to act on them, I shoo them away and get on with my life. On this one occasion, though, we had a continuous metabolic measurement system already set up, and were about to use it for measuring the metabolic rate of a rat. (There’s an interesting story behind that, but that’s for another time.)  So, for once, with the help of Thomas Förster (Senior Research Scientist at Sable Systems, which is to say he actually made the measurements and did all the hard work), I thought: What about using the system to measure photosynthesis?

    Well, the system wasn’t specifically designed for measuring photosynthesis, but adapting it to do so was trivial. Because it’s a pull system, it doesn’t require a sealed chamber around the plant, so we could simply go down the road, purchase a few small decorative potted plants, cover them with simple transparent plastic bags, and place the input port of each channel of the system close to the top of each bag. You can see the tubing lengths inside the plastic bags in the photograph to the left. Because the system operates at a high flow rate of 2 L per minute, air is drawn up from the bottom of the bag, and all of the air that has been in contact with the plants is drawn into the tubing. From there, it is pulled into an accurate mass flow controlled pump, and then a subsample of the air is directed into an analysis chain, comprising a water vapor analyzer, a CO2 analyzer and an O2 analyzer. Above the plants, we installed a fluorescent grow light that was attached to a timer which turned it on and off at a fixed interval. We were measuring light levels, so it was easy to tell from the recordings when the light was on or off.

    As you can read here, the respirometry system that we were using provides essentially continuous, uninterrupted measurements on multiple channels simultaneously.

    And here are the results! The top trace shows CO2, with brown denoting CO2 production and green denoting CO2 consumption, i.e. photosynthesis. You can see that the system rapidly shifts from CO2 production to CO2 consumption when the light is turned on, and also very rapidly changes from CO2 consumption to CO2 production when the light is turned off. The dark periods are shaded. Data from just one plant are shown. Click on the graph* to enlarge it.

    The water vapor data are particularly interesting. They are on the bottom half of the graph. As you can see, there is a  strong inverse relationship between CO2 consumption and water vapor output, caused by the fact that the plant’s stomata were gradually opening wider and wider throughout the period of illumination. The effect was not caused by a slow time constant, as you can see from the immediate and drastic decrease in CO2 production, switching to CO2 consumption, as the light phase began. O2 (not shown) obediently followed the inverse kinetics of CO2. Needless to say, we used no chemical or thermal desiccants; all water vapor dilution compensation was performed mathematically.

    Of course, using this system to screen plants for photosynthetic and water use efficiency in practice – as opposed to for amusement, as here – would require knowledge of the plants’ leaf areas, and of the luminous intensity to which they are exposed. Neither is difficult to achieve.

    Just for fun, I included this graph in a talk that I gave at the Society for Integrative and Comparative Biology in New Orleans earlier this year. A plant physiologist happened by accident to be in the audience, and afterwards, we had some interesting conversations. The ability to obtain data of this quality from essentially unlimited numbers of plants in real time and effectively without interruptions is, shall we say, not without interest to certain parties.

    All of which goes to show that indulging in unbridled curiosity and curious whims can lead to interesting places. I commend it for your consideration.

    If you have any questions regarding this post, feel free to contact me directly.

     * Thanks to Thomas Förster, Ph.D., for making the measurements and creating the graph.


  • Distinguishing individual food uptake in communally housed mice using RFID

    Mice are communal beasts, just like rats. They live in groups, and separating them – as required for measuring food intake / food uptake or energy expenditure – stresses them, elevating cortisol levels and leading to to a host of unwanted side-effects. Using the right technology, however, obtaining separate food uptake recordings from communally housed mice is straightforward. This short article demonstrates just such an application, combining a Promethion mass measurement module (2 mg resolution) with RFID.

    To identify an animal using RFID, a simple and quick injection of a subdermal PIT (Passive Integrated Transponder) tag, about the size of a grain of rice, is required. There are two broad types of PIT tags; half duplex (HDX) and full duplex (FDX). For a variety of reasons, HDX PIT tags are preferable. Any vet or trained animal care technician can insert the tag. (A number of people are experimenting with them too.)

    The principle of HDX RFID PIT tags is simple. A nearby coil periodically generates an EMF field at (typically) 134 kHz. The PIT tag contains a resonant circuit that charges a capacitor while the coil is generating its EMF field. Then the coil switches from transmitting to receiving mode; the PIT tag uses the energy stored in the capacitor to generate its own EMF field, which transmits a unique ID code back to the coil. And voilà, RFID! (Super-over-simplified, you understand.)

    So, we can separate individual mice easily. But what about food uptake? Well, Promethion has a unique mass sensor based, like a lab balance, on a load cell, that allows extremely precise food uptake measurements. You can read about the principle here.

    A little simple design work and a short spell with a lasercutter resulted in a box that held the mass sensor and food hopper, and restricted access to the food hopper to one mouse at a time via a tube just wide enough for a single mouse to enter. The tube that limited access was adjacent to an RFID reader of our own design. (Existing commercial RFID readers are limiting and cumbersome; I frown on them.)

    The graph to the left is worth a thousand words. Click to embiggen it. The red trace corresponds to the ID of the mouse; either absent (no mouse in the feeder) or at two different levels, one corresponding to the ID of one mouse, the other to the ID of her nestmate. The blue trace corresponds to the mass of the hopper, which clearly shows the disturbance caused by feeding, and the change in food hopper mass before and after each feeding event by each mouse.

    As you can see, separating food uptake / intake data for each mouse is easy. The precise uptake amount of food consumed during each feeding event is easily and automatically obtained, together with meal duration and unique-to-Promethion data such as the force that the mouse applied to the hopper during the feeding event. Using this RFID-based technique, subtle differences between mice can be teased apart from the stress of isolation. Better for the mouse, and thus – because an unstressed mouse is a better experimental subject – better for research too.

    What about separating the metabolic rates (energy expenditures) of individual mice in a communal setting? All I can say is, stay tuned.

  • Combining a metabolic cage (with urine and feces collection) and respirometry: It’s easy!

    In some fields of research, a difficult balancing act exists between answering different questions. For example, a researcher may need to measure metabolic rates, while also needing quantitative measurements of urine and feces output.  Measuring compounds in the urine is often key to understanding questions such as the biochemical pathways by which drugs are metabolized, or determining excreted nitrogen levels. The feces, though not quite as romantic (comparatively speaking) as the urine, are also important, especially when studying animal models of human conditions such as celiac disease or deriving energy expenditure via (input – output) calculations.

     But here’s the thing. Measuring urine and feces output accurately requires a special device known as a metabolic cage, which you can see to your left, posing dramatically as HAL. There’s no getting around the fact that metabolic cages are unnatural and stressful environments for mice or rats. As a result, compared to home cages in which metabolic rates can be measured in relatively natural conditions, metabolic cages are certainly not an ideal compromise. You get accurate urine and feces output measurements, or you get unstressed metabolic rate measurements, take your pick. One of the two. It would be nice to be able to promise researchers some magic combination of the two, but as yet it doesn’t exist because the two fundamental requirements are contradictory.

    That said, it can be very useful to know what the real metabolic rate of a mouse in a metabolic cage actually is. Among other things, this tells you how the stress of being in a metabolic cage affects its metabolic rate. This is a useful index to discern just how stressed the animal actually is, and how representative your measurements are of animals in a natural state.

    Here’s a problem. Outmoded indirect calorimetry or metabolic phenotyping systems operate only in push mode, which absolutely requires totally sealing the habitat of the animal. Push mode is easy and cheap to implement, hence its popularity. But metabolic cages are extremely difficult to make airtight. And if a metabolic cage starts off being airtight, it is guaranteed not to stay that way. And, further, if a metabolic cage is to be used for push mode metabolic measurement, it must be specially manufactured for the purpose. And this unfortunately excludes the best-designed and most widely used metabolic cages.

    With Sable Systems’ Promethion, which is the only natively pull mode metabolic phenotyping system, it is trivial to convert practically any metabolic cages so that the metabolic rate of their inhabitants can be measured accurately and with excellent temporal resolution.

    For years, I’ve been chatting with Richard Goodman of Hatteras Instruments at scientific conferences. Hatteras makes beautifully designed and widely used metabolic cages. It struck me that converting them to use pull mode respirometry would be very, very easy. Finally, Richard and I actually did something about our long-standing conversations, and he sent me a metabolic cage to evaluate for metabolic measurement using a Promethion metabolic phenotyping system.

    Here is the same Hatteras cage, sitting next to an 8-channel Promethion metabolic phenotyping system with a blazing fast 2-minute cycle time through all eight cages, independent of the length of tubing attached to each cage. Click the image to embiggen it. Because a pull system is used, the cage doesn’t need to be sealed –  in fact, it has to be somewhat open to the ambient environment. By using a solid rather than a perforated lid, and installing a tubing fitting in the lid, air was pulled from the top chamber in which the mouse lives via the small open spaces in the food and water dispensers, which are in the two arms to either side of the metabolic cage. The urine and feces collection device can be seen in the bottom half of the cage. This ingenious device separates urine and feces, allowing each to be  independently collected. Hatteras also makes a refrigerated urine uptake collector if this is needed. In fact, Hatteras makes beautifully designed racks of 15 metabolic cages, which are just begging to be converted –  so easily! –  to allow simultaneous measurement of the metabolic rates of multiple animals via indirect calorimetry.

    Of course, these are just words. How about some proof?

    Glad you asked! Here are 1000 words – 24 hours of beautifully detailed metabolic data, recorded from a mouse in a Hatteras instruments metabolic cage. You can see the nocturnal and diurnal activity cycles very clearly. Click on the image to enlarge it.

    There are two basic choices to be made when selecting a metabolic phenotyping system. One is whether the system operates in push or pull mode, and the other is the temporal resolution of the system.

    To address the first point, no metabolic phenotyping system exists that can easily be reconfigured from push into pull mode or vice versa without compromising usability, accuracy or both. They are either natively push, or natively pull, from the ground up. Don’t believe anyone who tells you otherwise. And as you can see, pull systems have enormous advantages, including very low stress home cage environments –  and, of course, the ability to easily adapt a wide variety of other habitats, including metabolic cages, for metabolic measurement.

    To address the second point, a multiplexed metabolic phenotyping system can serve the majority of research needs, provided its cycle time is sufficiently fast. Legacy metabolic phenotyping systems suffer from pitifully slow cycle times, anything from 15 to 45 minutes for cycling through 16 cages. Promethion-M systems, in contrast, boast cycle times down to two minutes, and maintain those cycle times irrespective of the lengths of tubing connecting the system to the cages (this is a major, major disadvantage in legacy systems, especially those that operate in push mode). If there is a need for even greater speed, such as for fast drug pharmacokinetic studies, Promethion-C systems dedicate a complete gas analysis chain to each cage, and have a temporal resolution of just one second for all cages.

    Either of these Promethion systems can be used with home cages outfitted for food and water uptake, body mass, running wheel, position and activity detection, and more –  or, completely interchangeably, with metabolic cages, such as those from Hatteras Instruments. The same system can be used for either. It’s your decision, based on your research priorities for a particular scientific question. And you always have our expert Ph.D.-level technical and scientific support to rely on, “By Scientists, For Scientists”.

    If you have any questions, feel free to contact me!

  • Tiny Food Intake Events (Micro-Intakes) Can be Important!

    Many food intake events (= food uptake events) are too small for legacy “food intake measurement systems” or metabolic phenotyping systems to detect. Each of these feeding events corresponds to a neurological signal to feed, even if the actual amount is small. As such, they convey important behavioral information. I can easily imagine a gene knockout or a treatment that might affect micro-intake events while leaving macro-intake events unchanged – an important distinction to which most food intake measurement systems currently on the market are oblivious, but which Promethion can easily detect.

    The list to the left, which is a small section of a food intake analysis spreadsheet, shows 7 food intake events from a C57BL/6J mouse. (Parenthetically, it’s interesting to see the reactions of people who are used to mouse food intake amounts expressed to the nearest 0.01 g or even 0.1 g, when they see this level of precision.) You can see that two of the events, highlighted, are below 10 mg.

    This is where things get especially interesting. Legacy food or water intake measurement systems (which is to say, everything on the market except for Promethion) do not claim to detect food or water intake events less than about 10 to 20 mg. Promethion, on the other hand, was designed with fanatical attention to the highest possible resolution. In fact, intake events down to 2 mg can easily be detected. To achieve this level of resolution (about 1 part in 500.000) purely digital data transfer is essential. I blame my background in comparative physiology, concentrating on very hard-to-make measurements on small animals, for that emphasis on high resolution. Now, unexpectedly, it has opened a new window on the feeding behavior of laboratory mice. (Of course, this would also work for fluid or water intake.)

    The first question that pops to mind is – are these tiny events actually real,  or are they the result of random noise in the measurement equipment? Well, there is an easy way to test the random noise hypothesis. Each intake event is the result of comparing a stable mass before the intake event with a stable mass after the intake event. Each of those masses has a mean, a standard deviation and an N. Each is normally distributed. As a result, they can be compared using Student’s t statistic, which evaluates the probability of the two masses differing by chance.

    And here you see the result.  As you can see, the larger intake events have extremely high t values, corresponding to microscopically tiny probabilities (any probability below 0.001 is displayed as zero). But the micro-intake events also have a very respectable t values, demonstrating that there is no realistic probability that they are the result of random fluctuations in the measurement equipment. (This is also very obvious when looking at the raw data, which shows clear disturbances in the mass record during the micro-intake events; see below.)

    If you’re interested, you can look at an image of a more complete section of the spreadsheet, automatically generated by the Promethion data analysis program, here.

    But let’s do a belt-and-braces proof for you skeptics out there. To do so, let’s select the intake event denoted by the solid yellow bar at the bottom of the above image, and look at the raw data from which that data point was derived. This level of drill-down capability is, of course, unique to Promethion.

    To the left, you can see a graph of the food hopper mass vs. time. This is raw data – no smoothing or any other processing was applied.

    As the graph begins, the food hopper is untouched. Then the mouse starts to feed from the hopper, in the process exerting a downward force on the hopper that causes its measured mass to increase. (You might have noticed a column called UpF_g_min in the spreadsheet excerpt above; this is the integrated force that the mouse applied to the hopper during each feeding event, with the units g/min – which may be an indicator of motivational state, and is a measurement [again] unique to Promethion.) Finally the mouse leaves. The means and standard deviations of the hopper mass before and after the 7 mg feeding event are shown on the graph. For a larger version, click here. There’s no debating that the feeding event is real.

    The second question that pops to mind is, of course, who cares? The micro-intake events don’t contribute particularly significantly to total food intake! Why worry about them? Why not just ignore them? (Especially if you can’t measure them in the first place.)

    I respectfully disagree. As I covered briefly in the introductory paragraph:

    Each of these micro-intake events corresponds to a neurological signal to feed (even if the actual amount is small) and as such, it conveys important behavioral information. I can easily imagine a gene knockout or a treatment that might affect micro-intake events, perhaps by raising the satiation threshold, while leaving macro-intake events unchanged – an important distinction that traditional food intake measurement systems and metabolic phenotyping systems would miss. Promethion owes its ability to detect these intake events to Sable Systems‘ many years of experience with ultrahigh resolution circuitry, and the use of load cells (as in lab balances) as mass transducers combined with the archiving of the entire raw data stream, which provides maximum flexibility of analysis.

    I can think of many interesting research questions that arise from this. To take an easy example, are macro-intake events that follow multiple micro-intake events characterized by a slower intake rate? I see signs that that may be the case, but haven’t yet investigated this in detail. If you take the idea and run with it, good for you – I have more ideas than can ever be actually implemented.

    I welcome your input on this, and any questions you may have. I can be contacted here.


  • Sex, lies, and water vapor

    OK, don’t get your hopes up. This will be the last mention of sex in this blog entry. However, we will deal at length with lies and water vapor, especially lies (OK, OK, let’s just call it simple misunderstandings) about the feasibility of using direct water vapor measurement to correct mathematically for the dilution effects of water vapor on respiratory gases.

    Without getting into the philosophy of natural laws, we can say that there are certain ironclad physical principles from which we cannot escape, and many of them are governed by simple equations. One obvious example is the calculation of dilution effects in simple mixtures of gases. A principle at the root of metabolic measurement using flow-through respirometry, by the way.

    Competition is healthy – at its best, it keeps our wits sharpened. At its worst, when the irrational is promoted, it can approach the ridiculous. When considering water vapor and how to correct for its presence in the air stream, it is important to acknowledge the physics and respect the mathematics – defy this and run the risk of appearing the fool. It has come to my attention that some instrumentation resellers to biomedical research labs are attempting to discount the value to respirometry of measuring water vapor. One wonders why they are tilting at the windmill of universal physical principles. Granting them the benefit of the doubt, perhaps they do not understand basic principles such as Dalton’s law of partial pressures. Perhaps they do not have a water vapor analyzer for sale and therefore need to justify archaic methods that have become obsolete.

    Whatever the reasons for that claim, here are the basics.

    In the case of metabolic measurement, our aim is to remove water vapor from the gas stream prior to calculating VO2 and VCO2. If water vapor is not removed, huge errors may result, especially in VO2. More accurately, the dilution effect of water vapor must be removed. The only disagreement comes in how that dilution effect is removed. Legacy systems compensate for the dilution effect of water vapor by simply removing it from the air stream. Of course, this is difficult to do reliably, and every method of scrubbing water vapor from air streams suffers from major disadvantages. What are these?

    • Chemical scrubbers have significant volume associated with them, can interact with CO2, and have a limited lifetime. They may also pose significant disposal issues.
    • Thermal scrubbers reduce the temperature of the air stream to about 1°C in the hopes of condensing the water vapor out of the air stream. This approach has two main problems. First, thermal scrubbers use heat pumps and associated paraphernalia that are quite complex and prone to failure. Second, and more significant, thermal scrubbers do not in fact remove all of the water vapor from the air stream. A water vapor partial pressure of about 0.65 kPa is left behind. If incurrent water vapor pressures decline below this point, which in some locations can be quite common, oxygen is suddenly less diluted and its concentration rises. Thus, VO2 is falsely elevated, and RQ is falsely diminished.

    In search of an intelligent solution to these dilemmas, I suggested in my 2008 respirometry textbook, “measuring metabolic rates: a manual for scientists”, that these antiquated approaches should be replaced by mathematical compensation for water vapor dilution. In that book, I gave the very simple equation required to do so. It is:

    O2’ = O2 * BP / (BP – WVP)

    Not exactly complex! O2’ is mathematically dried O2 concentration, and O2 is oxygen concentration diluted by water vapor with water vapor pressure WVP. Finally, BP is barometric pressure in the same units as WVP. The same equation holds for any other gas species, such as CO2.

    Not long after my book was published, this technique was put to its ultimate and most grueling test. Using the gold standard of respirometry validation, the propane burn, the mathematical water vapor dilution compensation technique provided far more accurate results than legacy techniques such as thermal water vapor scrubbers. You can read the original paper here – its citation details are at the end of this post.

    Here is proof. This is a section of figure 2 from the above paper. The mathematical water vapor dilution compensation technique yields the results shown in the solid lines, while removal of water vapor using a thermal scrubber yields the results shown in the dotted lines. The target RQ is exactly 0.6, which is the stoichiometric result of burning propane in our atmosphere.

     On the left, the two techniques yield equivalent results (click on the image to embiggen it). This is when the incurrent air stream contains a significant amount of moisture. But when the air stream is drier (dewpoint < 1°C), the thermal scrubber can no longer dry the air stream effectively, resulting in an overestimate of VO2 and thus a huge, honking underestimate of RQ (VCO2/VO2). This is clearly seen in the right of the figure.

    So not only does the mathematical water vapor dilution compensation technique yields equivalent results to legacy methods under ideal conditions, its results are actually significantly superior under adverse conditions!

    There are also manuscripts in preparation (full disclosure: I am a co-author on one) that show an almost perfect match between the respirometry quotient of the animals, and the food quotient of the food they are eating. These studies use the Promethion system, both multiplexed and continuous, and would be seriously in error if the mathematical water vapor dilution compensation technique did not work. Curiously, many studies that use legacy systems show no such match, calling the accuracy of their RQ measurements into serious doubt. No wonder, when they rely on antiquated, primitive, low-tech, failure-prone techniques to eliminate water vapor dilution. Promethion, in contrast, doesn’t ban water vapor; it says to water vapor, “Welcome! Glad to have you, but we need to measure you just as we also measure O2 and CO2.” And, measuring water vapor leads to a host of additional advantages. These include measurement of metabolic water production and, potentially, the mathematical drying of food intake.

    Anyone concerned about the reception by scientific referees of the mathematical  water vapor dilution compensation technique, merely needs to refer to my textbook, and to the above paper, combined with the ever-growing  number of citations in the primary literature that use the Promethion system. If anyone tries to sow fear, uncertainty and doubt (FUD) about this technique, please put me in touch with them. I promise to treat them with the respect they deserve.

    A list of publications that I know use the mathematical  water vapor dilution compensation technique, is appended. Now, I would like to address the salespeople who are trying to cast doubt on validity and scientific acceptance of this method: Are they calling the authors of these papers, some of the most careful scientists in their fields, incompetent? Are they saying that the American Journal of Physiology, PLoS One, the American Journal of Clinical Nutrition, Molecular Metabolism, and the Proceedings of the American Academy of Sciences, are disreputable rags that would publish flawed science? Who are they to imply such things? What relevant qualifications do these salespeople have? What is their record of contributions to scientific research? I thought so.

    To sum up: In a mixture of gases, every gas has a partial pressure, and the sum of all of the partial pressures in that gas mixture is the total pressure. In the case of the atmosphere, the total pressure is equal to barometric pressure. If you measure all of the requisite pressures, both partial and total, then you can dry gas samples mathematically as shown in the above equation. A slight rearrangement of similar equations, adding in flow rate, allows the calculation of metabolic rates. You can’t have one without the other!

    I encourage you to be the judge, applying your trust to the principles of the behavior of biophysical compounds found in Handbook of Chemistry and Physics. Apply your skepticism to any who propose that you bypass those standards.

    Citations:


    Morton GJ, Thatcher BS, Reidelberger RD, Ogimoto K, Wolden-Hanson T , Baskin DG, Schwartz MW, Blevins JE (2012) Peripheral oxytocin suppresses food intake and causes weight loss in diet-induced obese rats. American Journal of Physiology 302 E134-E144, DOI: 10.1152/ajpendo.00296.2011

    Kaiyala KJ, Morton GJ, Thaler JP, Meek TH, Tylee T, et al. (2012) Acutely Decreased Thermoregulatory Energy Expenditure or Decreased Activity Energy Expenditure Both Acutely Reduce Food Intake in Mice. PLoS ONE 7(8): e41473. doi:10.1371/journal.pone.0041473

    Cappel DA, Palmisano BT, Emfinger CH, Martinez MN, McGuinness OP, Stafford JM (2013) Cholesteryl ester transfer protein protects against insulin resistance in obese female mice. Molecular Metabolism: ISSN 2212-8778, http://dx.doi.org/10.1016/j.molmet.2013.08.007

    Shechter A, Rising R, Albu JB, St-Onge M-P (2013) Experimental sleep curtailment causes wake-dependent increases in 24-h energy expenditure as measured by whole-room indirect calorimetry. American Journal of Clinical Nutrition DOI: 10.3945/ajcn.113.069427

    Nordström V, Willershäuser M, Herzer S, Rozman J, von Bohlen O, Halbach SM, Meldner S, Rothermel U, Kaden S, Roth FC, Waldeck C, Gretz N, de Angelis MH, Draguhn A, Klingenspor M (2013) Neuronal Expression of Glucosylceramide Synthase in Central Nervous System Regulates Body Weight and Energy Homeostasis. PLoS Biol 11: e1001506. doi:10.1371/journal.pbio.1001506

    Staropoli JF, Haliw L, Biswas S, Garrett L, Holter SM, et al. (2012) Large-Scale Phenotyping of an Accurate Genetic Mouse Model of JNCL Identifies Novel Early Pathology Outside the Central Nervous System. PLoS ONE 7: e38310. doi:10.1371/journal.pone.0038310

    Melanson EL, Ingebrigtsen JP, Bergouignan A, Ohkawara K, Kohrt WM, Lighton JRB (2010) A new approach for flow-through respirometry measurements in humans. Am J Physiol Regul Integr Comp Physiol. 2010 June; 298: R1571–R1579 doi:  10.1152/ajpregu.00055.2010

    Minor BD, Heusinger DE, Melanson EL, Hamilton K, Miller BF (2012) Energy Balance Changes the Anabolic Effect of Postexercise Feeding in Older Individuals. J Gerontol A Biol Sci Med Sci 67: 1161-1169. doi: 10.1093/gerona/gls080

    Markwald RR, Melanson EL, Smith MR, Higgins J, Perrault L, Wright KP (2013). Impact of insufficient sleep on total daily energy expenditure, food intake, and weight gain. Proceedings of the National Academy of Sciences 110: 5695-5700 doi:10.1073/iti1413110


  • Barometric Pressure vs Altitude

    Barometric Pressure vs. Altitude Table
    Altitude Above Sea Level Temperature Barometer Atmospheric Pressure
    Feet Miles Meters °F °C In. Hg. mm Hg. PSI Kg/cm² kPa
    -5000   -1526 77 25 35.58 903.7 17.48 1.229 120.5
    -4500   -1373 75 24 35.00 889.0 17.19 1.209 118.5
    -4000   -1220 73 23 34.42 874.3 16.9 1.188 116.5
    -3500   -1068 71 22 33.84 859.5 16.62 1.169 114.6
    -3000   -915 70 21 33.27 845.1 16.34 1.149 112.7
    -2500   -763 68 20 32.70 830.6 16.06 1.129 110.7
    -2000   -610 66 19 32.14 816.4 15.78 1.109 108.8
    -1500   -458 64 18 31.58 802.1 15.51 1.091 106.9
    -1000   -305 63 17 31.02 787.9 15.23 1.071 105.0
    -500   -153 61 16 30.47 773.9 14.96 1.052 103.1
    0   0 59 15 29.92 760.0 14.696 1.0333 101.33
    500   153 57 14 29.38 746.3 14.43 1.015 99.49
    1000   305 55 13 28.86 733.0 14.16 0.996 97.63
    1500   458 54 12 28.33 719.6 13.91 0.978 95.91
    2000   610 52 11 27.82 706.6 13.66 0.960 94.19
    2500   763 50 10 27.32 693.9 13.41 0.943 92.46
    3000   915 48 9 26.82 681.2 13.17 0.926 90.81
    3500   1068 47 8 26.33 668.8 12.93 0.909 89.15
    4000   1220 45 7 25.84 656.3 12.69 0.892 87.49
    4500   1373 43 6 25.37 644.4 12.46 0.876 85.91
    5000 0.95 1526 41 5 24.90 632.5 12.23 0.86 84.33
    6000 1.1 1831 38 3 23.99 609.3 11.78 0.828 81.22
    7000 1.3 2136 34 1 23.10 586.7 11.34 0.797 78.19
    8000 1.5 2441 31 -1 22.23 564.6 10.91 0.767 75.22
    9000 1.7 2746 27 -3 21.39 543.3 10.5 0.738 72.40
    10,000 1.9 3050 23 -5 20.58 522.7 10.1 0.71 69.64
    15,000 2.8 4577 6 -14 16.89 429.0 8.29 0.583 57.16
    20,000 3.8 6102 -12 -24 13.76 349.5 6.76 0.475 46.61
    25,000 4.7 7628 -30 -34 11.12 282.4 5.46 0.384 37.65
    30,000 5.7 9153 -48 -44 8.903 226.1 4.37 0.307 30.13
    35,000 6.6 10,679 -66 -54 7.06 179.3 3.47 0.244 23.93
    40,000 7.6 12,204 -70 -57 5.558 141.2 2.73 0.192 18.82
    45,000 8.5 13,730 -70 -57 4.375 111.1 2.15 0.151 14.82
    50,000 9.5 15,255 -70 -57 3.444 87.5 1.69 0.119 11.65
    55,000 10.4 16,781 -70 -57 2.712 68.9 1.33 0.0935 9.17
    60,000 11.4 18,306 -70 -57 2.135 54.2 1.05 0.0738 7.24
    70,000 13.3 21,357 -67 -55 1.325 33.7 0.651 0.651 4.49
    80,000 15.2 24,408 -62 -52 0.8273 21.0 0.406 0.406 2.80
    90,000 17.1 27,459 -57 -59 0.520 13.2 0.255 0.255 1.76
    100,000 18.9 30,510 -51 -46 0.329 8.36 0.162 0.162 1.12